▸ Trading Psychology
The Complexity Trap: Why More Indicators Won’t Fix Your Trading
Every struggling trader eventually arrives at the same fork in the road and takes the wrong turn. The account is bleeding, the confidence is gone, and there’s one explanation that conveniently lets you off the hook: you just haven’t found the right indicator yet. So you add one. Then a strategy from a YouTube video. Then a second timeframe, a third oscillator, a news filter, and — if you’re really far gone — something involving moon phases. It feels like work. It feels like progress. It is neither.
Here’s the uncomfortable truth this article is going to keep circling back to: complexity is almost never the solution to a trading problem. It’s usually the symptom. The trader drowning in indicators and hopping between strategies isn’t one tweak away from breaking through — they’re using complexity to avoid the thing that’s actually broken. Let’s talk about why that happens, what it costs, and how stripping it all back is the least glamorous and most effective fix in trading. (Trading psychology, explained)
Why we reach for complexity in the first place
Markets are probabilistic, and probability is deeply uncomfortable. Any single trade can lose no matter how good the setup, and the human brain hates that. So we look for something — anything — that feels like certainty. A new indicator promises to remove the doubt. A more intricate strategy promises to catch what the simple one missed. Adding complexity feels like buying insurance against uncertainty, even though all you’ve really bought is more things to stare at.
It’s also a matter of blame. If you’re losing and the problem is your discipline — you moved your stop, you oversized, you revenge-traded — that’s a hard mirror to look into. But if the problem is that your setup “needs more confirmation,” well, that’s fixable with a download. Complexity is where traders go to avoid admitting the issue was never the tools. It’s far more comfortable to believe you have a knowledge gap than a behavior gap. (Why most traders fail)
The indicator illusion
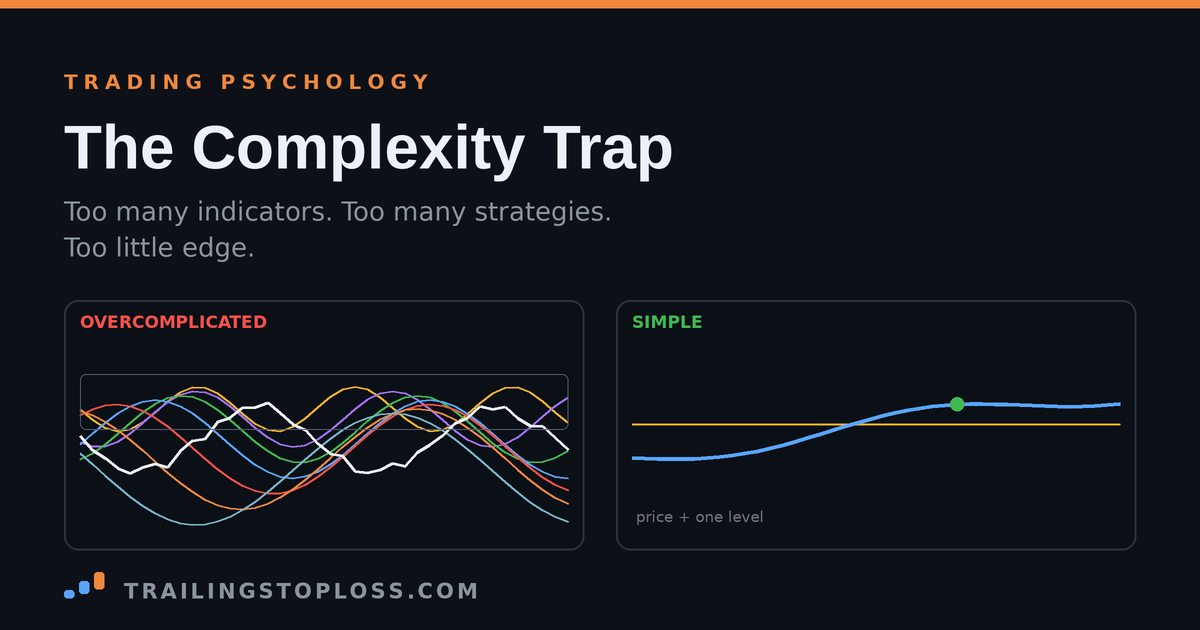
Open the chart of a struggling trader and you’ll often find the same thing: price is barely visible under a pile of RSI, Stochastic, MACD, CCI, Williams %R, three moving averages, Bollinger Bands, and a volume profile for good measure. It looks sophisticated. It is mostly redundant. The dirty secret of the indicator drawer is that nearly all of them are calculated from the same two inputs — price and volume — so most of them are telling you the same thing in slightly different fonts.
Stack five momentum oscillators and you do not have five independent signals. You have one signal — momentum — shouting at you five times. That’s not confirmation; it’s an echo chamber, and echo chambers feel reassuring precisely because everyone in them agrees. Worse, indicators are derived from past price, which means they lag by design. By the time all seven of your oscillators finally nod in unison, the move you were waiting for is already a memory and you’re entering at the exact spot the early money is taking profit.
None of this means indicators are useless. A single tool that answers a specific, honest question — “is this trending or ranging?” — can earn its place. The problem isn’t the indicator; it’s the pile. Every one you add doesn’t stack a new edge on top of the last. It adds a new way to talk yourself into a trade, a new way to talk yourself out of one, and one more thing obscuring the only variable that actually pays you: price itself.
The strategy carousel
If the indicator pile is one half of overcomplication, strategy-hopping is the other. It goes like this: you adopt a system, trade it for two weeks, hit a normal losing streak, decide it’s “not working,” and jump to a shinier one that’s currently in its winning phase. Repeat forever. You are always starting over, which means you never accumulate the one thing that actually reveals whether an edge exists: a large enough sample.
This is variance doing what variance does, and the strategy-hopper misreads it every time. Every edge on earth — even a genuinely good one — goes through losing streaks that feel like the system is broken. The hopper abandons ship at the drawdown, which is statistically the worst possible moment, and resets their sample to zero. They mistake the normal noise of a small sample for a verdict on the strategy. The result is a trader with five years of experience who has, in reality, the same two weeks of experience 130 times over. (The win-rate fallacy)
The tell is the search itself. If you’re hunting for a “better strategy,” the honest question is usually not whether your last one had an edge — it’s whether you ever gave it enough repetitions, traded with consistent size, and followed it without improvising. Most abandoned strategies weren’t disproven. They were never actually tested. (The confidence trap)
What all this complexity actually costs you
That last one is the quiet killer. The entire point of a trading process is to generate a clean feedback loop — do the thing, see the result, adjust. Complexity poisons the loop. When a hundred variables produce a win or a loss, you learn nothing you can act on, so you reach for the only lever that feels available: add another variable. And the machine that got you stuck spins one more time. (Fear of pulling the trigger)
Why simple actually wins
Here’s the part that stings: the edge was never in the setup. Two traders can take the identical entry — same level, same trigger — and one makes money over a year while the other loses it, because the difference is in the execution and the risk management, not the signal. A simple system you understand in your bones, and can execute the same way under pressure, beats a complex one you follow mechanically and abandon the moment it’s tested. (Risk management & stops)
Simplicity isn’t a compromise you make because you’re not smart enough for the complicated version. It’s the goal. A simple process is faster to execute, easier to trust, and — critically — has fewer parts to break when your heart rate is up and real money is on the line. Under stress, every trader reverts to whatever is automatic. If your process is a ten-step checklist, stress will shred it. If it’s one clear setup you’ve repeated a thousand times, stress can’t touch it. (Trading on tilt)
🧠 The one-trade-a-day versionThe most radical simplification isn’t fewer indicators — it’s fewer decisions. A one-trade-a-day framework strips the entire day down to a single question: is this the trade, or not? One high-quality decision, made once, protects you from the fatigue, the overtrading, and the revenge spirals that complexity feeds. It’s not a limitation. It’s the whole edge for a lot of traders.
How to strip it back down
Start by subtracting, not adding. This is the reflex you have to break. When something isn’t working, the instinct is to add — a filter, a confirmation, a timeframe. Do the opposite. Remove one indicator and trade without it for two weeks. Did your results actually get worse? If not — and it almost never is — it was noise, and you just found something you can delete forever.
Get to price plus one or two tools, maximum. Price is the truth; everything else is commentary on it. Keep the one or two tools that answer a specific question you actually use — trend vs. range, or where the key levels are — and clear the rest off the chart. If you can’t say out loud what question a tool answers, it’s decoration.
Define your setup in a single sentence. If you can’t describe the trade you’re looking for in one clear line — the level, the trigger, the context — it’s too complicated to execute consistently, which means it’s too complicated to trust or to improve. One well-defined setup traded well beats ten fuzzy ones traded badly.
Track the simple version and let the data talk. The reason to simplify isn’t aesthetic — it’s that a simple process finally gives you a clean feedback loop. Log every trade, and after a month you’ll be able to see, in plain colors, whether your one setup actually has an edge. That’s a question you literally cannot answer while ten variables are in the mix.
Simplify, then measure. Track your one setup on the free P&L Calendar and let a month of results tell you the truth — no login, no cost.
Open the free P&L Calendar →The work you were avoiding
Strip away the indicators and the strategy-hopping and you’re left standing in front of the thing complexity was protecting you from the whole time: the actual work. Patience. Sitting on your hands when there’s no trade. Taking the loss without flinching. Holding your size. Following the plan on the day it’s boring and the day it hurts. None of that is downloadable, and none of it is fun, which is exactly why the indicator drawer is so seductive.
The best traders aren’t running the most sophisticated systems. They’re running simple ones with ferocious discipline. The complexity you keep chasing is a very convincing decoy — it lets you feel productive while never touching the part of the game that decides who keeps their account. Put the decoy down. Trade simpler. Then go do the hard, quiet work the simplicity just exposed. (Start with the psychology pillar)
Keep pulling the thread: understand the win-rate fallacy so a losing streak stops sending you strategy-shopping, learn why most traders fail the evaluation, and catch tilt before it undoes a simple, disciplined month.
FAQ
How many indicators should I actually use?
As few as possible — often zero, and rarely more than one or two. Price and market structure carry most of the useful information; a single tool that answers a specific question (trend vs. range, or key levels) can earn a spot. Stacking multiple momentum indicators mostly repeats the same signal, because they’re all derived from the same price data.
Why do I keep switching trading strategies?
Usually because you’re mistaking a normal losing streak for a broken system. Every real edge goes through drawdowns; abandoning a strategy at the drawdown resets your sample to zero, so you never accumulate enough trades to know whether it works. The problem is rarely the strategy — it’s that it was never actually tested over a large enough sample with consistent execution.
Does a simple trading strategy really work better than a complex one?
For most traders, yes — not because simple is magic, but because a simple process is faster to execute, easier to trust, and has fewer parts to break under pressure. Your edge lives in execution and risk management far more than in the setup itself, and simplicity is what makes disciplined execution repeatable when real money is on the line.
Is price action better than using indicators?
Price action isn’t automatically “better,” but it is the primary source — indicators are calculated from price, so they lag it. The useful framing isn’t price action versus indicators; it’s signal versus noise. Trade primarily from price and structure, and add a tool only if it answers a question you can’t answer from the chart alone.
How do I know if I’m overcomplicating my trading?
A few tells: you can’t describe your setup in one sentence, your chart has so many indicators that price is hard to see, you switch strategies every few weeks, or you routinely miss valid entries because you’re waiting for one more confirmation. If any of those sound familiar, the fix is subtraction — remove tools and rules until your process is something you can execute the same way every time.
What’s the simplest way to start improving right now?
Pick one setup, define it in a single sentence, remove everything else from your chart, and log every trade you take for a month. A clean, simple process gives you a clean feedback loop — which is the only way to actually learn whether your edge is real and where your leaks are.
Educational content from TrailingStopLoss on trading process and psychology. Nothing here is investment advice, and no approach — simple or complex — removes the substantial risk of loss in trading. You are responsible for your own decisions.


