▸ Free Trader Tool
The Free P&L Calendar: Track Every Trade, Spot Every Pattern
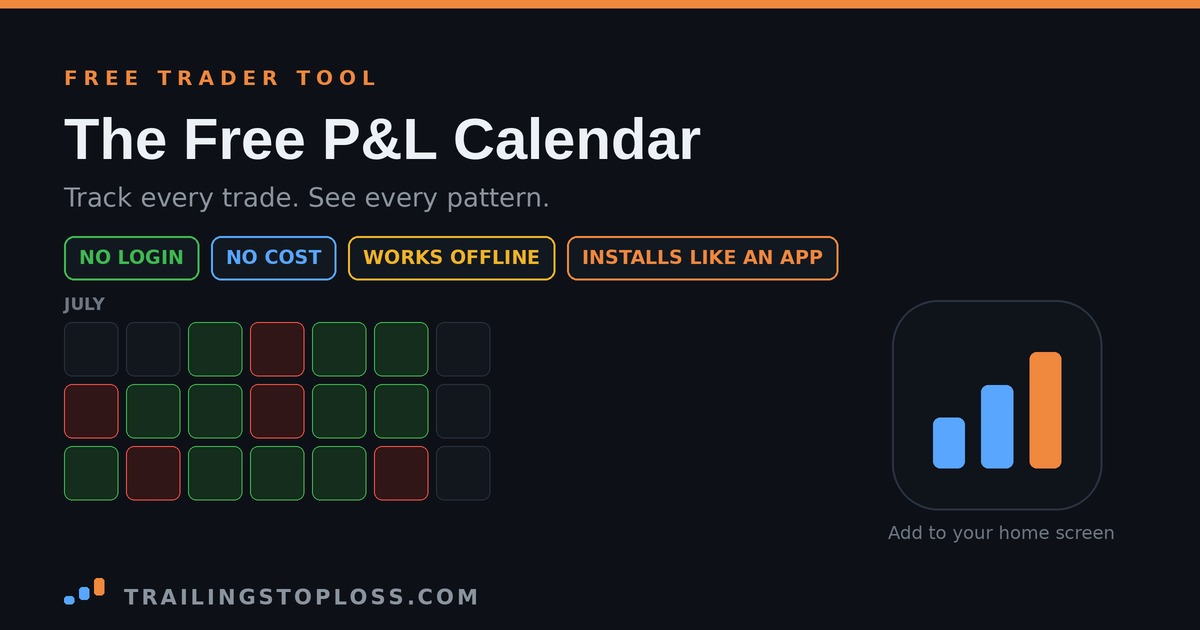
Most traders don’t have a strategy problem. They have a visibility problem — they can’t see their own patterns, so they keep repeating them. A P&L calendar fixes that in the simplest way possible: every trading day gets a colored square, and after a few weeks the truth is impossible to miss. Green Fridays. Red Mondays. The revenge-trade day that gave back a whole good week. This one is free, takes no signup, stores nothing on our servers, and installs on your phone or PC like a real app. Here’s how to use it.
Ready to start? Open it in your browser — nothing to download, no account to create.
Open the free P&L Calendar → Free forever · no signup · works offline · your data stays on your deviceWhy a calendar beats a spreadsheet
You can track trades in a spreadsheet, and plenty of people do. But a spreadsheet hides the thing that actually matters — the shape of your results over time. A calendar makes it visual and immediate: you don’t read your month, you see it. Colors do the work your willpower can’t, because a wall of red squares in the second half of the month is a pattern your brain can’t argue with.
That matters more than it sounds, because the data on why traders fail is blunt: across a dataset of 300,000+ prop accounts, most failures came from loss-limit breaches and behavioral leaks — revenge trading, oversizing, tilt — not from bad setups. Those are exactly the patterns a calendar surfaces: the cluster of losses after a big win, the one oversized red day, the days you traded when you should have sat out. You can’t fix a leak you can’t see. (Why most traders fail the evaluation)
What it does
How to use it
Log a trade. Tap any day on the calendar. A panel opens for that date. Pick Win, Loss, or Break-even, then enter your R multiple, your dollar P&L, or both — the sign is set automatically by the result, so a Loss of “800” stores as −$800. Add the instrument and a note if you like, and tap Add trade. Took three trades that day? Add all three; the day totals them up.
Read a day. Once a day has trades, its cell fills with your net for the day (green if positive, red if negative), your trade count, and the win/loss breakdown underneath. Green months and red months become obvious at a glance — which is the whole point.
Edit or fix. Reopen any day, tap a logged trade to edit it, or hit the × to delete. The month summary at the top — net P&L, net R, win rate, trading days — recalculates instantly.
🧠 The one-trade-a-day angleIf you follow a one-trade-a-day discipline framework, the calendar becomes a scorecard for the process, not just the P&L. A month where every day has exactly one trade is a month you held your rules — even the red days. That’s the version of “winning” that actually compounds. More on that in our trading psychology guide.
Install it like an app — on any device
You don’t have to open a browser and type a URL every time. The calendar is a progressive web app, which means you can add it to your home screen or desktop and launch it with one tap — full-screen, no browser bar, works offline, no app store required. Here’s how on each device. (MDN: installing web apps)
🍎 iPhone & iPad
- Open trailingstoploss.com/pnl-calendar/ in Safari (it must be Safari for the app-style launch).
- Tap the Share button — the square with an upward arrow.
- Scroll down and tap Add to Home Screen.
- Tap Add. The icon appears on your home screen and opens the calendar full-screen.
🤖 Android
- Open the calendar in Chrome (Edge or Brave also work).
- Tap the ⋮ menu in the top-right — or use the in-app Add to Home Screen button when it appears.
- Tap Install app (or Add to Home screen on older versions).
- Confirm. The icon installs and launches standalone, like any other app.
🖥️ Windows (Chrome or Edge)
- Open the calendar in Chrome or Edge.
- Look for the install icon in the address bar — a small monitor with a downward arrow (or a ⊕ symbol).
- Click it and choose Install. (No icon? Use the ⋮ menu → Install P&L Calendar / Apps → Install this site as an app.)
- It opens in its own window and lands in your Start menu and taskbar — launch it like any desktop program.
🍎 Mac
- Chrome / Edge: open the calendar, click the install icon in the address bar → Install. It appears in your Dock and Applications.
- Safari 17+: open the calendar, then in the menu bar choose File → Add to Dock.
- Launch it from the Dock or Spotlight — it runs in its own window, no browser chrome.
However you install it, the icon is the same blue-and-orange bar mark, and tapping it drops you straight into the calendar. To remove it later, uninstall it like any app (delete from the home screen on mobile; uninstall from Start/Applications on desktop). (MDN: managing installed web apps)
Share your month
Tap Share my month and the calendar renders your whole month — the grid, your net P&L, your win rate — as a clean branded image. On a phone it opens your share sheet, so you can post it straight to Instagram, Facebook, or X; on a computer it downloads the image to post wherever you like. It’s a good accountability nudge, and honestly, a green month is worth showing off. Just remember the market humbles everyone eventually — screenshot the red ones too, and learn from them.
Your data stays yours
This is the part the paid journals can’t say as cleanly: your trades never leave your device. There’s no account because there’s no server storing your history — everything saves locally in your browser or installed app. That’s a privacy win, and it’s why there’s no login. The one trade-off worth knowing: because it’s stored per device, your phone and your laptop keep separate journals, and clearing your browser data will erase it. So use the built-in Export button now and then to save a backup file — and Import it if you switch devices or browsers.
⚠ Back up your dataBecause everything is stored locally, treat Export like saving a document. Tap it every week or two, keep the backup file somewhere safe, and you’ll never lose your history to a cleared cache or a new phone. It takes five seconds and it’s the one habit that keeps a local-first tool worry-free.
Start tracking today
The best trade journal is the one you’ll actually use — and the friction of logins, subscriptions, and clunky apps is why most people quit tracking by week two. This one removes all of it: open it, tap a day, log a trade. Do that for a month and you’ll see patterns you’ve been blind to for years. That’s where the improvement actually comes from — not another indicator, but finally seeing your own tendencies in color.
Open it now — and add it to your home screen so it’s one tap away tomorrow.
Open the free P&L Calendar → Then pair it with the trading psychology guide to fix what it reveals.Once you can see your patterns, put them to work: understand why most traders fail the evaluation, learn to spot trading on tilt before it costs you, and if you’re funding an account, compare real costs on the True Cost hub.
FAQ
Is the P&L Calendar really free?
Yes — completely free, with no signup, no email, no subscription, and no trial that expires. There’s no account because your data is stored locally on your own device, not on a server. Open it and start logging.
Do I need to create an account or download anything?
No. It runs in any modern browser with nothing to install. If you want it as an app icon on your phone or computer, you can add it to your home screen or desktop in a few taps — but that’s optional, and still requires no app store or account.
How do I add the calendar to my home screen?
On iPhone/iPad: open it in Safari, tap Share, then Add to Home Screen. On Android: open it in Chrome, tap the menu, then Install app. On Windows or Mac: open it in Chrome or Edge and click the install icon in the address bar. Once added, it launches full-screen like a native app.
Where is my trade data stored, and is it private?
Everything is stored locally in your browser or installed app on your device — nothing is sent to or stored on our servers, which is why there’s no login. That makes it private by default. The trade-off is that data lives per device, so use the Export button to back up your journal and Import to move it between devices.
Can I log more than one trade per day?
Yes. Tap a day and add as many trades as you took — each with its own win/loss/break-even result, R multiple, dollar amount, instrument, and note. The day cell then shows your net for the day plus a win/loss breakdown, and the month summary totals everything up.
Does it work offline?
Yes. It’s a progressive web app, so once it has loaded (or once you’ve installed it), it works with no internet connection — open it and log trades anytime. Your entries save locally and are there next time you open it.
TrailingStopLoss builds free, no-nonsense tools for retail traders. The P&L Calendar is an educational journaling tool; your entries are stored on your own device. Nothing here is investment advice, and tracking your trades doesn’t guarantee results — trading carries substantial risk of loss.


