Greed Doesn’t Lower Your Edge. It Removes You Before the Edge Pays.
Four traders, identical expectancy of +0.10R per trade, differing only in how they collect it — small frequent wins versus rare large ones. After 500 trades against the same drawdown, 95% of the small-win accounts are still alive and 7% of the big-win accounts are. The arithmetic says they’re the same strategy. The survival column says one of them is a job and the other is a story.
Swinging for the fence doesn’t reduce your edge at all. It reduces the chance you’re still trading when the edge arrives.
Four ways to earn exactly the same thing
Set up four approaches with the same expectancy. Each makes +0.10R per trade — identical on paper, and a spreadsheet would call them interchangeable:
| Style | Reward:risk | Win rate | Expectancy |
|---|---|---|---|
| Small wins | 1:1 | 55% | +0.10R |
| Moderate | 1:2 | 36.7% | +0.10R |
| Big wins | 1:5 | 18.3% | +0.10R |
| Lottery | 1:10 | 10% | +0.10R |
Every one of these is a genuinely profitable method. Nobody here is wrong about direction, nobody is overtrading, nobody has a broken system. The only difference is how lumpy the returns are.
What compounding does to lumpy returns
Risk 1% of equity per trade and compound 1,000 trades from $10,000:
| Style | Median ending | Worst 10% | Best 10% | Ended below start |
|---|---|---|---|---|
| Small wins 1:1 | $25,858 | $17,333 | $38,576 | 0% |
| Moderate 1:2 | $24,737 | $13,616 | $43,619 | 2% |
| Big wins 1:5 | $20,493 | $8,478 | $52,537 | 15% |
| Lottery 1:10 | $16,253 | $4,590 | $57,548 | 32% |
The median outcome falls from $25,858 to $16,253 with no change in expectancy whatsoever. That’s the volatility tax: you compound through your drawdowns as well as your gains, and a 20% loss needs a 25% gain to undo. Bigger swings mean deeper holes, and deeper holes cost more to climb out of than they cost to fall into.
Look at the last column too. Nearly a third of the lottery traders finish below where they started after a thousand trades of a provably profitable method. They did nothing wrong. They were right about the market and still went backwards.
Look at the best-10% column: the lottery style tops out at $57,548 against the small-win style’s $38,576. If you only care about the ceiling, swinging big genuinely raises it. That’s the trade people are making, usually without saying it out loud — accepting a worse median and a one-in-three chance of going backwards for a better jackpot. It’s a coherent preference. It just isn’t the one most people think they’re expressing when they hold for the bigger move.
Now add a drawdown limit
The compounding numbers above assume you’re allowed to keep trading. On a funded account you aren’t. Run the same four styles against a drawdown of 25R — a correctly sized account, not a tight one:
| Style | Survived 500 trades | Median worst drawdown | Longest losing streak |
|---|---|---|---|
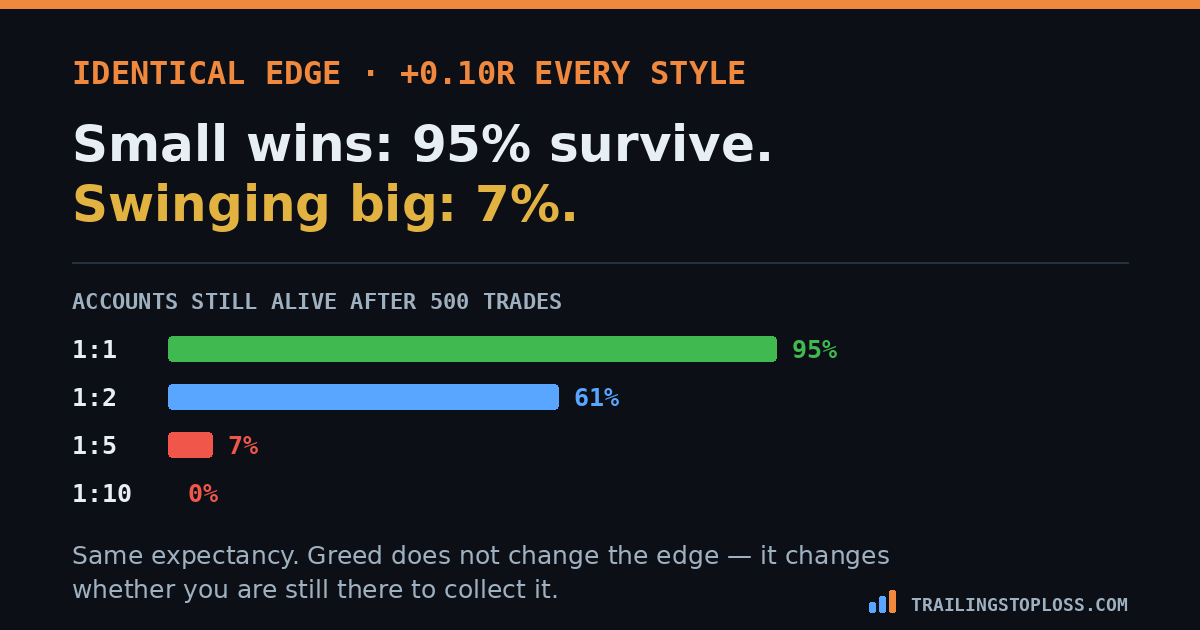
| 1:1 @ 55% | 95% | 13.0R | 7 losses |
| 1:2 @ 36.7% | 61% | 19.0R | 11 losses |
| 1:5 @ 18.3% | 7% | 22.0R | 18 losses |
| 1:10 @ 10% | 0% | 23.0R | 22 losses |
This is the finding. Ninety-five percent versus seven percent, on the same edge. Not a different strategy, not a worse read, not bad discipline — the identical expected value, collected in bigger lumps, and almost nobody is left to collect it.
The last column is the part people underestimate most. The 1:1 trader’s worst stretch is seven losses in a row. The 1:5 trader’s is eighteen, and the lottery trader’s is twenty-two. Those are the median experiences, not the horror stories — and the strategy requires sitting through them without changing a single thing, after you’ve just watched eighteen consecutive losses and have every reason to believe you’re broken.
Greed never introduces itself as greed
Nobody holds a winner thinking “I am being greedy.” The thought is always something more respectable:
- “I’m letting my winners run.” Legitimate advice, right up until it becomes a reason to refuse a target that works.
- “Small wins won’t change my life.” True in a week. False over a thousand trades, where they compound to more than the big swings do.
- “I’m playing for the asymmetric payoff.” Asymmetry is real, but you need to survive long enough to receive it, and that’s the condition nobody prices in.
- “I’m being efficient with my capital.” The efficient route is more contracts at the target that works, not the same contract held for a target that doesn’t.
- “I just need one good trade.” This is the one that’s actually dangerous, because it’s usually said from inside a drawdown and it converts a bad week into a closed account.
Every one of those is greed wearing the clothes of strategy. The tell isn’t the sentiment, it’s the direction: greed always argues for more — more size, more distance, more trades — and never for less.
What small wins actually buy
They aren’t just safer. They’re the structure that lets everything else work.
- A sample you can learn from. At 55% win rate you get feedback constantly. At 10% you need hundreds of trades before your results mean anything, and separating a real edge from noise already takes about 389 trades at the easy end.
- Streaks short enough to survive psychologically. Seven losses hurts. Twenty-two ends most people regardless of what the math says.
- Drawdowns shallow enough to compound through. 13R against 23R, which is the whole difference between a dip and a breach.
- The option to scale. A high-win-rate, low-variance method can carry more size for the same risk of ruin — so the small-win trader can get to big numbers by adding contracts, which is the route that actually multiplies expectancy.
Stop thinking of small wins as settling for less. The small-win trader and the lottery trader have the same edge — but one of them has a 95% chance of being there in a year and the other has 7%. Taking the small win isn’t the humble option. It’s the one that’s still trading.
The honest limits
These styles were constructed to have identical expectancy, and real ones don’t. If your setup genuinely delivers a higher edge at 1:5 than at 1:1 — measured, on a real sample — then the comparison changes and the bigger target may be worth its variance. The point is that equal expectancy is not equal outcome, not that wide targets are always wrong.
The model assumes independent trades at a fixed win rate. Real results cluster and real edges drift, so treat the survival percentages as showing the shape of the problem rather than forecasting your account.
And low variance doesn’t rescue a method with no edge. Everything here starts from +0.10R per trade. Collect a negative expectancy in small frequent pieces and you simply lose steadily instead of dramatically — which is arguably worse, because it takes longer to notice.
The short version
Four approaches with identical expectancy of +0.10R per trade — 1:1 at 55%, 1:2 at 36.7%, 1:5 at 18.3% and 1:10 at 10% — are the same strategy on paper. Compounded over 1,000 trades at 1% risk, the median result falls from $25,858 to $16,253 purely from variance, and 32% of the lottery-style traders finish below where they started despite a provably profitable method. Against a 25R drawdown over 500 trades, 95% of the small-win accounts survive against 7% of the 1:5 accounts and none of the 1:10 accounts, with the median longest losing streak running from 7 consecutive losses to 22. Greed doesn’t lower your edge — it raises the variance you have to live through to collect it, and almost nobody lives through it. The only honest case for big targets is the top decile, which really is higher; everything else about that trade is worse.
Frequently asked questions
Why does greed ruin traders?
Not by reducing the edge — by raising the variance needed to collect it. Four styles with identical expectancy of +0.10R per trade produce wildly different outcomes: compounded over 1,000 trades the median result falls from about $25,858 at 1:1 to $16,253 at 1:10, and against a drawdown limit 95% of the small-win accounts survive against none of the lottery-style ones. The strategy is the same. The chance of still being there to use it is not.
Are small consistent wins better than big wins?
At equal expectancy, yes, on almost every measure that matters: higher median outcome, shallower drawdowns, shorter losing streaks and a far higher chance of surviving a drawdown limit. The single exception is the top decile — the best 10% of big-win outcomes genuinely exceed the best 10% of small-win outcomes. If you only care about the ceiling, swinging big raises it, at the cost of a worse median and a one-in-three chance of going backwards.
What is volatility drag in trading?
The gap between your arithmetic expectancy and what you actually compound. Because losses and gains compound together, a 20% loss requires a 25% gain to recover, so deeper drawdowns cost more to climb out of than they cost to fall into. Two strategies with the same expected value per trade will produce different ending balances, and the one with larger swings ends lower — in simulation, about $9,600 lower on a $10,000 account over 1,000 trades.
How long are the losing streaks in a big-target strategy?
Much longer than most people plan for. At 1:1 and a 55% win rate the median longest losing run over 500 trades is 7 consecutive losses. At 1:5 it is 18, and at 1:10 it is 22. Those are typical experiences rather than worst cases, and the strategy requires trading through them without changing anything — immediately after watching eighteen losses in a row and having every reason to think the method is broken.
How do I know if I’m trading greedily?
Greed rarely sounds like greed — it sounds like letting winners run, playing for asymmetry, being efficient with capital, or needing one good trade. The reliable tell is direction rather than sentiment: the greedy decision always argues for more, whether that is more size, more target distance or more trades, and never for less. If a change to your plan happens to increase your exposure and arrived as a feeling rather than from measured data, that’s the one to be suspicious of.
Related on this site: add a contract, don’t move the target · the day after your best day · why you’ll never get comfortable with losing · should you trail your stop
Figures come from 20,000–30,000 simulated runs: compounding results over 1,000 trades at 1% of equity per trade from a $10,000 start, and survival over 500 trades against a 25R drawdown. All four styles were constructed to have an identical expectancy of +0.10R per trade so that variance is the only difference between them. The model assumes independent trades at a fixed win rate; real results cluster and real edges drift. Nothing here is financial advice. Futures trading carries substantial risk of loss.