Trade Log, 9 October: Paid at 1:1, Stopped Out at 1:2 — Same Entry
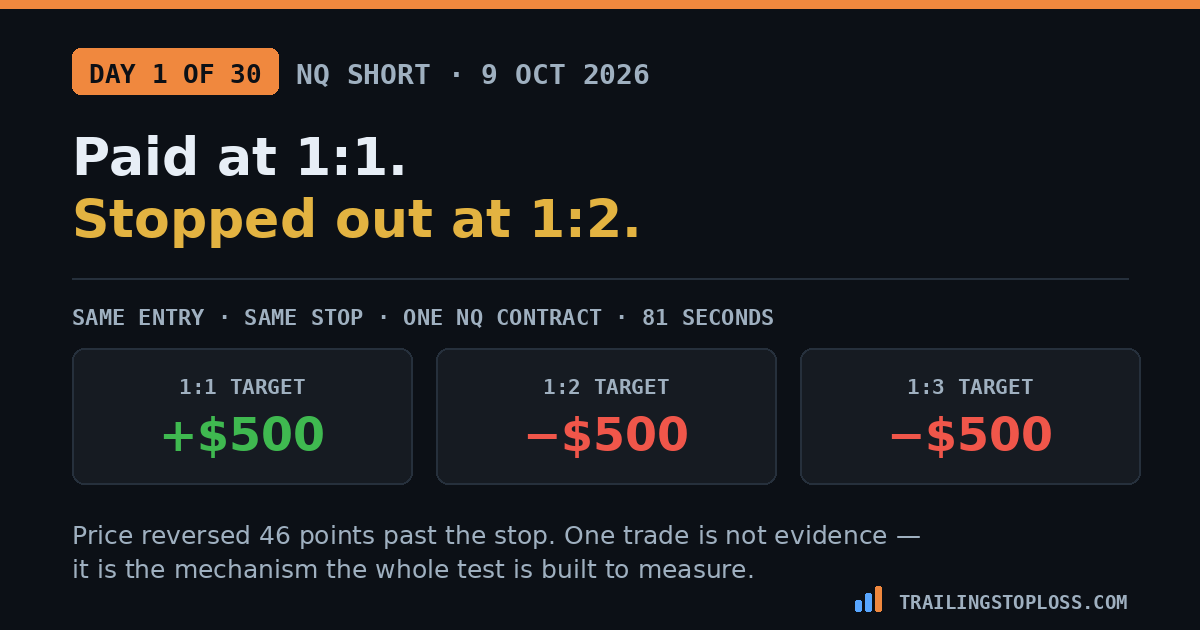
A short on NQ fifteen minutes after the open. Entry at 31,034.75, stop 100 ticks above, target 100 ticks below. The target filled in eighty-one seconds for +$500. Price then reversed and finished forty-six points beyond where the stop sat — so the identical trade held for 1:2 or 1:3 would have been a $500 loss. One trade proves nothing. It does show the mechanism exactly.
The gap between taking 1:1 and holding for 1:2 on this single trade was $1,000.
The trade

Eighty-one seconds from fill to fill, and the stop never came into play — the take profit filled first and the OCO pair closed itself, which is why the stop shows as cancelled rather than triggered.

What would have happened at a wider target
The levels were drawn before the entry, so there’s no reconstruction involved:
| Target | Price needed | Further downside required | Outcome |
|---|---|---|---|
| 1:1 | 31,009.75 | — | +25 pts / +$500 |
| 1:2 | 30,984.75 | 25 more points | −25 pts / −$500 |
| 1:3 | 30,959.75 | 50 more points | −25 pts / −$500 |
Price didn’t stall short of 1:2 and grind back. It reversed hard. Against an entry of 31,034.75, the market subsequently traded at 31,106.56 — 71.81 points the wrong way, and 46.81 points beyond the stop. A 1:2 or 1:3 order wasn’t a close call. It was a full stop-out with the market continuing away.
Taking the 1:1: +$500. Holding for 1:2: −$500. Same entry, same stop, same read on the market, same eighty-one seconds — a $1,000 swing decided entirely by where the exit order sat.
What this is and isn’t
It would be easy to present this as proof, and it isn’t one. The thirty-day test running on this site exists precisely because single trades can’t settle the question — a strategy with no edge at all shows a profit over thirty trades 43% of the time, so one trade is noise with a screenshot attached.
What it does do is show the mechanism cleanly. The argument against wider targets isn’t that big moves never happen. It’s that a target is a bet on how far price travels before it turns, and the further out you put it the more often the turn arrives first. Today the turn arrived immediately after 1:1 — and because the stop stays fixed while the target moves away from it, every point you add to the target is a point of additional opportunity for exactly this.
Worth noting what this trade also isn’t: a case for trailing. Had the stop been tightened as price fell, it would most likely have been taken out in the retracement before reaching 1:1 — tightening converts winners into scratches faster than it saves losers. The order that paid was the one placed before entry and left alone.
The honest limits
This is one trade, selected after the fact because it illustrates a point. The reversal could just as easily have continued down, in which case 1:3 would have printed $1,500 and this page would not exist. That asymmetry in what gets written up is exactly why the thirty-day log records every trade regardless of outcome.
Fifteen minutes after the open is a specific condition. A mean-reverting, high-volatility window is close to the worst case for a wide target. On a trending afternoon the same test could easily go the other way.
And the 1:2 and 1:3 outcomes are counterfactual. They assume the stop stays where it was and the trade is otherwise managed identically — a reasonable assumption given the orders were resting, but still a reconstruction rather than a filled order.
The short version
Short NQ at 31,034.75 at 08:45:21, stop 100 ticks above at 31,059.75, target 100 ticks below at 31,009.75. The target filled at 08:46:42 — eighty-one seconds — for +25 points and $500 on one contract. Price then reversed to 31,106.56, which is 71.81 points against the entry and 46.81 points beyond where the stop sat, so the same trade held for 1:2 (30,984.75) or 1:3 (30,959.75) would have been stopped out for −$500. That’s a $1,000 swing on one trade decided by nothing except the position of the exit order. One trade is not evidence and this one was chosen because it makes the point, but it shows the mechanism: a target is a bet on how far price goes before it turns, and the further out it sits, the more often the turn gets there first.
Frequently asked questions
What was the trade?
A short on NQ entered by sell stop at 31,034.75 at 08:45:21 on 9 October 2026, fifteen minutes after the cash open. The stop loss sat 100 ticks above at 31,059.75 and the take profit 100 ticks below at 31,009.75. The take profit filled at 08:46:42 for 25 points, or $500 on a single contract, with a total holding period of eighty-one seconds.
Would a 1:2 target have worked on this trade?
No. The 1:2 level was 30,984.75, requiring 25 more points of downside than the trade delivered. Price turned at the 1:1 level and reversed to 31,106.56 — 71.81 points above the entry and 46.81 points beyond the stop. A 1:2 or 1:3 order would have been stopped out for a 25-point loss, turning a $500 gain into a $500 loss on one contract.
Does one trade prove 1:1 is better?
No, and it isn’t offered as proof. A strategy with no edge at all shows a profit over thirty trades roughly 43% of the time, so a single result carries essentially no information about which target is better. This trade illustrates the mechanism — that a target is a bet on how far price travels before reversing — rather than settling the question, which needs a sample in the hundreds.
Why not trail the stop to lock in profit on a trade like this?
Because tightening a stop as price moves in your favor tends to convert winners into scratches faster than it saves losers. In simulation, a tight trail raised win rate from 39% to 68% while cutting expectancy by 59%. On this trade a tightened stop would likely have been taken out during the retracement before the 1:1 level filled. The order that paid was the one placed before entry and then left alone.
Related on this site: the 30-day 1:1 vs 1:2 vs 1:3 test · add a contract, don’t move the target · should you trail your stop · why I don’t trade news events
All prices and timestamps are taken from the broker order log for CME_MINI:NQ1! on 9 October 2026; times are US Central. Dollar figures assume one full-size NQ contract at $20 per point. The 1:2 and 1:3 results are counterfactual, reconstructed from the resting stop and the subsequent price path. A single trade is an illustration, not evidence. Nothing here is financial advice. Futures trading carries substantial risk of loss.