I’m Testing 1:1 vs 1:2 vs 1:3 for 30 Days. Here’s the Method, Before I Know the Answer.
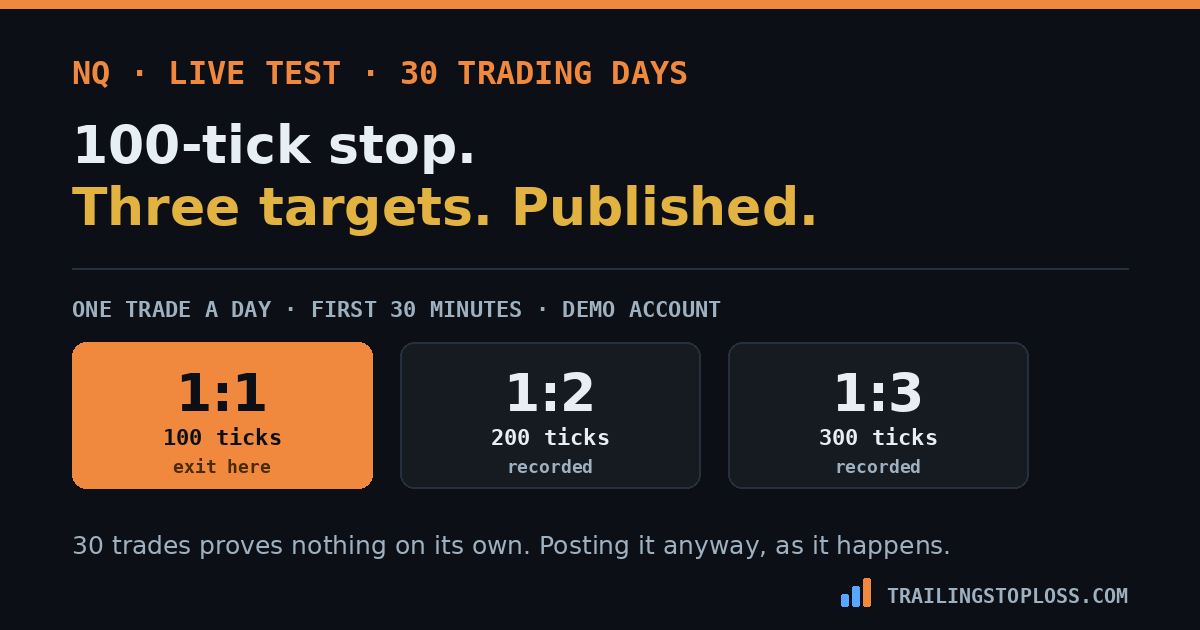
One trade a day on NQ, first thirty minutes of the open, demo account, thirty trading days. 1R is 100 ticks — a 100-tick stop against a 100-tick target. I’ll take every trade at 1:1 and record whether it would also have reached 1:2 and 1:3 — one sample scored three ways. Results published as they happen, win or lose, starting with this page so the method is on record before the data exists.
And the first thing to say is that thirty trades cannot settle this. I’m running it anyway, for reasons below.
The rules, fixed in advance
| Parameter | Setting |
|---|---|
| Instrument | NQ (E-mini Nasdaq-100) |
| Window | First 30 minutes after the cash open |
| Frequency | One trade per day, maximum |
| Duration | 30 trading days |
| Account | Demo — this is a change to a live method, so it gets tested before it gets funded |
| Risk (1R) | 100 ticks = 25 NQ points |
| Executed target | 1:1 — 100 ticks |
| Also recorded | Whether price reached 200 ticks (1:2) and 300 ticks (1:3) |
| Stop | Fixed at entry. Not moved, not trailed, not brought to breakeven |
| Reporting | At least weekly, possibly daily — including the losing weeks |
Writing the rules down before the first trade is the entire point of doing it this way. A method that gets adjusted mid-test produces a number that describes the adjusting, not the method.
What 100 ticks actually means on NQ
NQ ticks are 0.25 points and $5 each on the full contract, so the whole test scales off one number:
| Level | Ticks | NQ points | NQ | MNQ |
|---|---|---|---|---|
| Stop (1R) | 100 | 25 | $500 | $50 |
| 1:1 target | 100 | 25 | $500 | $50 |
| 1:2 target | 200 | 50 | $1,000 | $100 |
| 1:3 target | 300 | 75 | $1,500 | $150 |
A 25-point stop sits inside one 5-minute ATR on a normal open, which runs 20–45 NQ points and stretches to 50–100 on a fast one. That’s a deliberate choice rather than an accident: a stop narrower than the noise gets taken out by the noise, and the opening thirty minutes is the noisiest window of the day.
The 1:3 target is the one to watch. Seventy-five points is roughly two to four times the 5-minute ATR, so it isn’t a level the open reaches casually. If the answer turns out to be 1:3, it will be because a handful of trades ran a long way, not because most of them nudged past.
$500 of risk per trade against 25 losing trades of room needs $12,500 of drawdown. A typical 50K prop account carries $2,500. On MNQ the same 100 ticks is $50 a trade, needing $1,250 — so one or two micros fits comfortably and the full contract doesn’t come close. The demo test runs the same tick distances either way, but if this ever goes live on a funded account it goes live on micros.
Why score one sample three ways
The obvious way to run this is three separate tests: thirty days at 1:1, then thirty at 1:2, then thirty at 1:3. That takes four and a half months and produces a worse answer.
Taking every trade at 1:1 and recording the maximum favorable excursion afterwards means all three targets are scored on the same thirty trades. Each trade either reached 1R or didn’t, and if it did, it either continued to 2R and 3R or it didn’t. One set of entries answers all three questions, and because the comparison is paired rather than across separate samples, the noise that would swamp three small independent tests largely cancels out.
Simulating both designs against a known answer, the paired version picks the genuinely better target 82% of the time against 69% for three separate thirty-trade tests. Same thirty days of work, about 19% more accuracy, and it finishes in one month instead of five.
Exiting at 1:1 means the chart has to be watched after the exit to see where price went. That’s a data-collection problem, not a trading one, and it’s the one part of this that could quietly corrupt the results — recording MFE from memory an hour later is how you end up with data that flatters whichever answer you were hoping for. Each trade gets its excursion recorded the same day, from the chart, against the clock.
What the break-even rates already tell us
Before a single trade, arithmetic sets the bar each target has to clear:
| Target | Win rate needed to break even |
|---|---|
| 1:1 | 50% |
| 1:2 | 33% |
| 1:3 | 25% |
So the question isn’t which target feels better. It’s whether the drop in win rate from holding for 2R or 3R is steeper or shallower than the extra reward pays for. If 50% of trades reach 1R and 60% of those continue to 2R, the 1:2 target wins. If only 40% continue, 1:1 wins. That single number — what fraction of trades that touch 1R keep going — is what this experiment is really measuring, and I have no idea what it is for this setup in this window.
Why 30 trades can’t settle it
This is the part most experiment write-ups bury, so it goes near the top here.
Thirty trades is a tiny sample. Simulating a pure coin flip at 1:1 — a strategy with precisely zero edge — over thirty trades:
- It shows a profit 43% of the time
- It shows +4R or better 29% of the time
- 90% of outcomes land somewhere between −8R and +8R
And the reverse error is just as common: a genuinely profitable approach at 55% wins on 1:1 still shows a loss over thirty trades 23% of the time.
Win-rate precision is no better. Observe 50% across thirty trades and the true rate is somewhere between 32% and 68% — an interval 36 points wide, which spans “clearly losing” through “clearly winning” at every target on the list.
To distinguish a 50% coin flip from a real 60% edge at 1:1 with any confidence takes roughly 389 trades. To distinguish 50% from 55%, about 1,565. At one trade a day that’s eighteen months and six years respectively. Anyone presenting thirty trades as proof of a trading edge — including me, in four weeks — is presenting noise with a narrative attached.
So why run it
Three honest reasons, none of which is “to prove 1:2 is best.”
The paired design answers a narrower question that thirty trades can support. Not “is this strategy profitable” but “of trades that reach 1R in this window, what share keep going to 2R and 3R.” That’s a ratio measured on every trade rather than an edge measured against zero, and it stabilizes far faster than a P&L figure does.
Thirty days is enough to kill an idea, even if it can’t confirm one. If only two trades in thirty get past 1R, 1:3 is dead and no further testing is required. Negative results arrive much sooner than positive ones.
And it starts a sample that keeps growing. Thirty is the first month, not the conclusion. The data carries forward, and the figure that matters is the one at trade 400.
How the results will be reported
- Every trade, including the ones I’d rather not show. A running table of entry, exit, outcome at 1:1, and maximum favorable excursion in R.
- All three targets scored every week, not just the one that’s currently winning.
- The key ratio tracked separately — what percentage of trades reaching 1R continued to 2R and 3R.
- No mid-test rule changes. If the method looks wrong in week two, it stays as written and that becomes part of the result.
- The confidence interval alongside every number, so a good week reads as a good week rather than as a discovery.
What would change my mind
Stating this now, before the data, is the only way it means anything.
I currently expect 1:1 to win on this window. The first thirty minutes is a high-volatility, mean-reverting period where moves extend and snap back quickly, and a wide target only pays when the right tail is fat enough to fund the lower win rate — which is a property of trending conditions, not of the open.
If more than about half the trades that reach 1R go on to reach 2R, I’m wrong and 1:2 wins outright. If a third of them reach 3R, I’m badly wrong and I’ll say so in those terms.
The honest limits
Thirty trades is not evidence, and no amount of presentation makes it evidence. Whatever this produces will be reported as a first look at a growing sample, never as a finding.
It’s a demo account, which removes the variable that matters most. Demo fills are optimistic and demo money doesn’t hurt — the whole reason a strategy survives on paper and dies funded. A target that tests well here still has to survive the version of me that has money on it.
One window, one instrument, one trader. Nothing here generalizes to your setup, your session or your market, and the reason to read it is the method rather than the conclusion.
The short version
Starting now: one trade a day on NQ in the first thirty minutes after the open, thirty trading days, demo account. 1R is 100 ticks — 25 NQ points, $500 on the full contract and $50 on MNQ — so the 1:2 target is 200 ticks and 1:3 is 300. Every trade is taken at a 1:1 target, and whether price later reached 1:2 and 1:3 is recorded — so one sample of thirty trades scores all three targets instead of taking three separate months. Simulated against a known answer, that paired design picks the better target 82% of the time against 69% for three separate thirty-trade tests. The break-even rates set the bar: 50% wins at 1:1, 33% at 1:2, 25% at 1:3, so the real measurement is what fraction of trades touching 1R keep going. Thirty trades cannot settle it — a zero-edge coin flip shows a profit 43% of the time and +4R or better 29% of the time, and separating a 50% from a 60% win rate needs about 389 trades. It runs anyway because a negative result arrives fast, the ratio stabilizes quicker than a P&L, and this is the first month of a sample that keeps growing. Prediction on record: 1:1 wins on this window. Updates weekly, losses included.
Frequently asked questions
What is the best risk-to-reward ratio for day trading?
There isn’t a universal one — it depends entirely on what fraction of your trades that reach 1R continue further. The break-even win rates set the bar: 1:1 needs 50% wins, 1:2 needs 33%, and 1:3 needs 25%. A wider target only pays if the drop in win rate from holding longer is shallower than the extra reward compensates for, which is a property of your setup and session rather than a general rule.
How many trades do you need to test a strategy?
Far more than most people use. Distinguishing a 50% coin flip from a genuine 60% edge at 1:1 takes roughly 389 trades; separating 50% from 55% takes about 1,565. Over just 30 trades, a strategy with zero edge shows a profit 43% of the time and +4R or better 29% of the time, while a genuinely profitable method at 55% still shows a loss 23% of the time. A 30-trade result can rule an idea out but cannot confirm one.
How can you test three profit targets at once?
Take every trade at the smallest target and record the maximum favorable excursion — how far price traveled in your favor before the trade resolved. That scores all three targets on the same set of trades rather than requiring three separate samples. Because the comparison is paired, much of the noise cancels: simulated against a known answer, the paired design identified the better target 82% of the time versus 69% for three separate 30-trade tests, in a third of the calendar time.
How big is a 100-tick stop on NQ?
NQ ticks are 0.25 points, so 100 ticks is 25 points — $500 on the full contract at $5 a tick, or $50 on MNQ at $0.50. A 1:2 target is 200 ticks (50 points) and 1:3 is 300 ticks (75 points). For context, the 5-minute ATR in the opening thirty minutes runs 20 to 45 NQ points and can reach 100 on a fast open, so a 25-point stop sits inside one ATR while the 1:3 target is two to four times it.
Can you trade a 100-tick NQ stop on a prop account?
Not on the full contract at a sane size. Risking $500 a trade needs about $12,500 of drawdown to allow 25 losing trades, against the $2,500 a typical 50K prop account carries. On MNQ the same 100 ticks costs $50, needing roughly $1,250, so one or two micros fit the same account comfortably. The tick distances are identical — only the dollar value of each tick changes.
Why test a trading strategy on a demo account?
Because a change to a working method should be measured before it is funded, and an untested change on a live account risks real drawdown to learn something a simulated account can tell you. The trade-off is real: demo fills are optimistic and demo losses don’t hurt, so results transfer imperfectly — a target that tests well on paper still has to survive the psychological conditions of a funded account.
Does a higher risk-to-reward ratio mean a better strategy?
No. A higher ratio lowers the win rate you need but also lowers the win rate you get, and which effect dominates is an empirical question about your specific setup. A 1:3 target that only reaches its goal on one trade in five loses money, while a 1:1 target hitting 55% makes money. Expectancy — win rate multiplied by reward, minus loss rate — is the only figure that settles it, and the ratio alone tells you nothing about it.
Related on this site: should you trail your stop · why you’ll never get comfortable with losing · the odds of becoming profitable · picking an account size from your stop
Sample-size and design figures come from simulation: 100,000–200,000 modeled 30-trade sequences, with the paired-versus-unpaired comparison run against a known best target. Power calculations use a two-proportion test at 80% power. Contract specifications are CME standard for NQ and MNQ; ATR figures are typical normal-condition values and expand in volatile markets. This is a demo-account experiment on one instrument in one session window and is published as a method, not a result. Nothing here is financial advice. Futures trading carries substantial risk of loss.