Adding to a Winning Position: The Math, the Case For It, and What It Does to Your Head
Pyramiding is either the mechanism that pays for every losing trade you take, or the habit that turns your best trade of the month into a red day. The difference isn’t conviction. It’s one rule about where the stop goes — and almost nobody applies it.
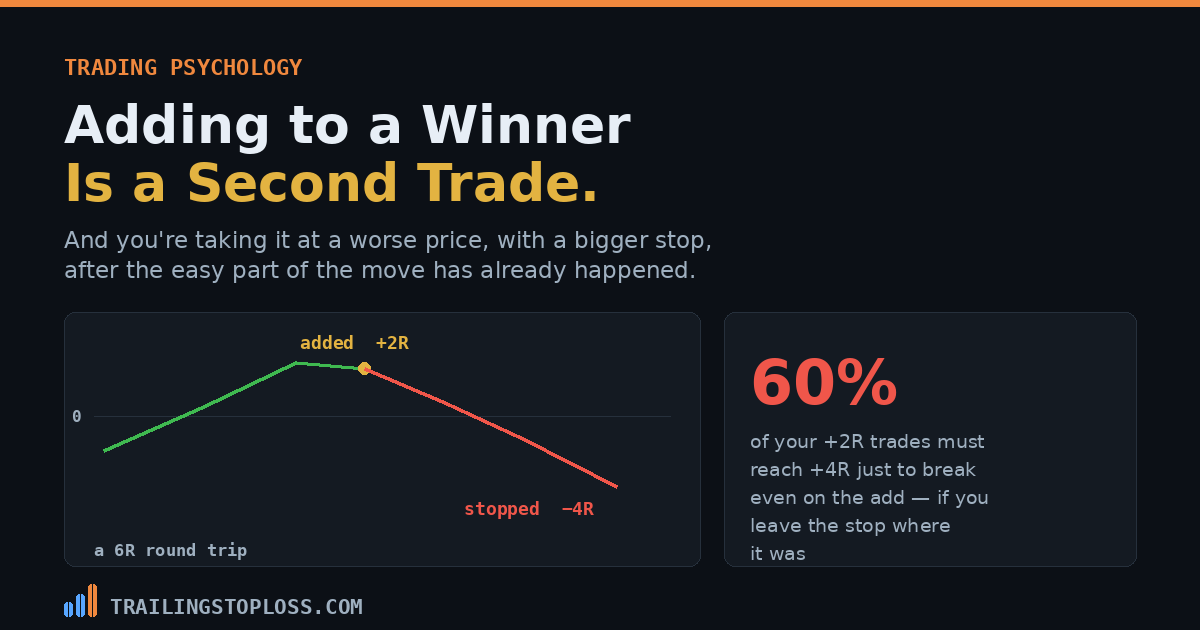
Adding to a winner is not an extension of your first trade. It’s a second trade, at a worse price, with a wider stop, taken after the easy part of the move has already happened.
Why it works when it works
The argument for pyramiding is genuinely strong and worth stating properly before taking it apart. In trend-following, nearly all the profit comes from a small number of large moves — the right tail pays for everything else. If your size is fixed, your biggest winner is capped at one unit’s worth of a move that might run for weeks. Adding lets position size scale with a trade that’s proving itself.
The Turtles built their whole system on it. Richard Dennis’s traders entered one unit on a Donchian breakout and added another every time price moved half an ATR — half an N, in their language — in their favor beyond the previous entry, up to four units in any one market. Dennis expected to be wrong most of the time; the Turtles’ win rate ran around 35–40%, and they made fortunes because the average winner was several times the average loser. (Take Profit Trader)
There’s a second, subtler benefit. Adding lets you take a smaller initial position than your conviction suggests, because you’re not committing your full size to an unconfirmed idea. You put on a probe, and you scale into it only once the market has agreed with you. Used that way, pyramiding reduces the cost of being wrong at entry rather than increasing the cost of being wrong later. (Original Turtle Rules, PDF)
The rule everyone omits
Here is the part that gets left out of nearly every article on pyramiding, and it’s the part that makes the whole thing work. The Turtles didn’t just add units — after each add, they moved the stops of every unit to 2N below the most recent entry. The whole position’s risk was re-anchored to the newest price, every single time. (Take Profit Trader)
That rule is what caps total exposure. Pyramided positions had stops raised specifically so maximum exposure stayed within the risk limit, which is a fundamentally different activity from adding units and leaving the original stop alone. (Financial Wisdom)
“Adding to winners” describes two completely different bets. One re-anchors the stop on every add and keeps total risk bounded. The other stacks size onto a fixed stop and lets risk compound. They share a name, they feel identical in the moment, and only one of them is what successful trend followers actually did.
What the math says
Take a standard setup: one unit, entry E, stop 1R below, target 4R. Price reaches +2R and you add a second unit. Everything now depends on what you do with the stop.
| Stop policy after adding | If it reaches +4R | If it reverses | Swing |
|---|---|---|---|
| No add — baseline | +4.0R | −1.0R | 5.0R |
| Add, stop unchanged | +6.0R | −4.0R | 10.0R |
| Add, stop to breakeven | +6.0R | −2.0R | 8.0R |
| Add, stop to +1R | +6.0R | 0.0R | 6.0R |
| Add, stop to +2R | +6.0R | +2.0R | 4.0R |
Read the second row carefully, because it’s the one most traders are actually running. You were up 2R. You added. The trade reversed and stopped you out for −4R. That’s a six-R round trip from peak to exit — and at a healthy expectancy of +0.40R per trade, six R is roughly fifteen disciplined trading days. One add, taken on a trade that was working, can cost three weeks. (Review of Asset Pricing Studies, 2020)
The number that actually decides it
Forget conviction. The add is worth taking only if trades that reach +2R go on to reach +4R often enough to pay for the ones that don’t. That’s a measurable frequency, and the threshold depends entirely on the stop policy.
| Stop policy | Share of +2R trades that must reach +4R |
|---|---|
| Stop unchanged | 60% |
| Stop to breakeven | 50% |
| Stop to +1R | 33% |
| Stop to +2R (second entry) | 0% |
Leave the stop alone and you need 60% continuation just to break even on the add. Move it up to +1R and you need 33%. That is the entire argument, and it isn’t a matter of taste — it’s the same trade with a different risk anchor, and the required hit rate nearly halves.
You already have the data to settle this. Take every trade that reached +2R and ask what fraction went on to +4R. If it’s under 60% and you add without moving your stop, the adds are costing you money — regardless of how the good ones felt. That’s the same MFE column that answers whether you’re cutting winners early, used from the other end.
What it does to your head
The psychology here is more specific than “greed”, and it’s worth naming precisely because the pull is strongest exactly when the trade is going well.
House money
Thaler and Johnson documented that after a gain, people accept risk they’d have refused from a cold start — the winnings haven’t yet been mentally filed as theirs, so risking them doesn’t feel like risking their own money. A position showing +2R is the purest form of that state. The add feels free because the money funding it doesn’t feel real yet. (Thaler & Johnson, SSRN)
The winner as evidence of skill
Gervais and Odean’s model describes traders inferring their ability from outcomes and taking too much credit for successes. A trade that’s working is immediate, vivid evidence that you read this one correctly — and the natural response to feeling correct is to be more correct, with more size. Their sharper finding applies directly: a more successful trader can have lower expected profits next period, because success generates the aggression. (Review of Financial Studies)
The add that isn’t in the plan
The practical tell is simple. A planned pyramid has its add levels, its size and its new stop written down before entry. An unplanned one arrives as a feeling at +2R — and it arrives most insistently on the trades that are running hardest, which is precisely when the remaining move is smallest and your average entry damage is largest.
Adding to a winner also gives back the thing that made the position comfortable. At +2R on one unit you could watch a pullback calmly. At +2R on two units with a worse average entry, the same pullback threatens a losing day. You’ve converted a trade you could hold into one you’ll want to manage — which is how a pyramid becomes a panic exit.
What it does to your statistics
Pyramiding quietly corrupts your record unless you decide one thing in advance: is R measured against your initial risk, or your total risk? Those give different numbers for the same trade, and mixing them makes every downstream figure meaningless.
- Initial-risk R flatters pyramided winners — a 4R move on a doubled position reads as +6R against a 1R denominator, and your expectancy looks better than the risk you actually carried.
- Total-risk R is honest but makes winners look smaller, and it changes retrospectively as you add, which is awkward to journal.
- Either is fine. Switching between them is not. Pick one, note it in your journal template, and never mix pyramided and single-entry trades in the same expectancy calculation without flagging which is which.
There’s a compounding version of the problem from the other side too: if you’re adding to winners and cutting some of them early, your R-multiple distribution is being stretched at one end and truncated at the other, and no amount of trade count will make that sample interpretable. (Review of Asset Pricing Studies, 2020)
Rules that make it survivable
- Write the add levels before entry. Price, size, and the new stop for the whole position. If it isn’t written, it’s not a pyramid — it’s an impulse with a rationale.
- Move the stop on every add. This is the Turtle rule and it’s non-negotiable. Re-anchor the whole position to the newest entry, so total risk stays bounded rather than compounding.
- Add smaller than the original. Half or a third of the first unit. Full-size adds double your damage while adding, at best, a partial move.
- Cap the number of adds. The Turtles stopped at four units in any one market. An uncapped pyramid is a position that reaches maximum size exactly when the move is most extended.
- Never add to recover. Adding after a pullback from your peak, to lower the average entry back to somewhere comfortable, is averaging down wearing a pyramid’s clothes.
- Log which trades were pyramided. One column. Without it you can’t ever compare the two approaches on your own data.
When not to bother
Pyramiding is a trend-following technique, and it needs a trend to pay for itself. Three cases where it’s the wrong tool:
Your setup has a defined target. If you’re trading a measured move to a level, adding at +2R on a 4R target buys you a second unit for the last half of a bounded move — the worst part of it, at the worst price. Pyramiding pays in open-ended trends, not in trades with a ceiling.
You’re on a prop account with a trailing drawdown. Intraday trailing drawdown tracks your peak unrealized equity, so a pyramided position that spikes and pulls back can breach the account while the trade is still open. Adding size raises the peak that your threshold is measured from, which is a specific and underappreciated danger. See how daily loss limits and trailing drawdown actually work.
You haven’t measured your continuation rate. Until you know what fraction of your +2R trades reach +4R, adding is a bet on a number you haven’t looked up. The Turtles pyramided into a system with a documented edge in extended trends and a 35–40% win rate they’d accepted in advance. That’s not the same as adding because this one feels good. (Take Profit Trader)
The short version
Adding to a winner is a second trade at a worse price, and whether it’s profitable depends almost entirely on one rule: what happens to the stop. Leave it where it was and you need 60% of your +2R trades to reach +4R just to break even on the add, while a reversal turns a +2R position into a −4R loss — a six-R round trip worth roughly fifteen disciplined days. Move the stop up to +1R with each add and the required continuation rate falls to 33%. That re-anchoring is exactly what the Turtles did and what almost every modern description of pyramiding leaves out. The psychology explains why: a winning position is house money, and it reads as evidence you were right. Write the add levels before entry, move the stop every time, add smaller than the original, cap the number of adds, and never add to recover a pullback. (Take Profit Trader)
Frequently asked questions
Should I add to a winning trade?
Only with a written plan and a stop that moves on every add. With the stop left where it was, roughly 60% of your trades that reach +2R must go on to +4R for the add to break even. Move the stop to +1R and that falls to about 33%. Whether it’s right for you is an empirical question about your own continuation rate, not a matter of conviction — and you can measure it from trades you’ve already taken.
What is pyramiding in trading?
Adding further units to a position that’s already moving in your favor, so size scales with a trade that’s proving itself. The Turtles added one unit every time price moved half an ATR beyond the previous entry, up to four units per market — and critically, moved the stops of every unit to 2N below the most recent entry each time they added, which kept total risk bounded.
Why did my winning trade turn into a big loss after I added?
Because the second unit doesn’t just risk its own stop distance — it risks the distance from where you added back down to the original stop. Add one unit at +2R with the stop unchanged and a reversal produces −4R rather than −2R, a six-R swing from the peak. That’s the standard failure mode, and it’s arithmetic rather than bad luck.
Where should the stop go when I add to a position?
Re-anchor the entire position to the newest entry rather than leaving the original stop in place. The Turtle rule was to move all units’ stops to 2N below the most recent add. Practically, moving to +1R after adding at +2R cuts the continuation rate you need from 60% to 33%. The cost is being stopped out more often on ordinary pullbacks, which is a real trade-off rather than a free lunch.
Does adding to winners mess up my expectancy calculations?
Yes, unless you fix one convention. Decide whether R is measured against your initial risk or your total risk, and never mix the two. Initial-risk R flatters pyramided trades — a 4R move on a doubled position reads as +6R against a 1R denominator — so your expectancy looks better than the risk you actually carried. Log which trades were pyramided in a separate column so you can compare the two approaches honestly.
Is adding to a winner the same as averaging down?
No, and confusing them is dangerous in both directions. Adding to a winner increases size on a position the market is confirming; averaging down increases size on one it’s rejecting. But there’s a hybrid worth naming: adding after a pullback from your peak, to bring the average entry back to somewhere comfortable, is averaging down in a pyramid’s clothing. The test is whether the add level was written before entry.
Related on this site: what cutting winners early does to your stats · why managing a trade usually means ruining it · why traders get worse after they start winning · daily loss limits and trailing drawdown
Worked figures use a 1R stop, a 4R target and a single add at +2R to illustrate the mechanism; your own numbers will differ, which is the point of measuring them. Nothing here is financial advice. Futures trading carries substantial risk of loss and is not suitable for every investor.