High Win Rate But Not Making Money? You're Cutting Winners EarlyHigh Win Rate, No Money: What Cutting Winners Early Does to Your Stats
You planned a 3:1 trade and closed it at 0.8R. The obvious cost is the 2.2R you left behind. The expensive cost is that almost every number you use to judge yourself just became unreliable — and the two you check most often now point in opposite directions.
Win rate goes up. Expectancy goes down. Only one of those is visible on a broker statement, and it’s the wrong one.
The headline effect, in numbers
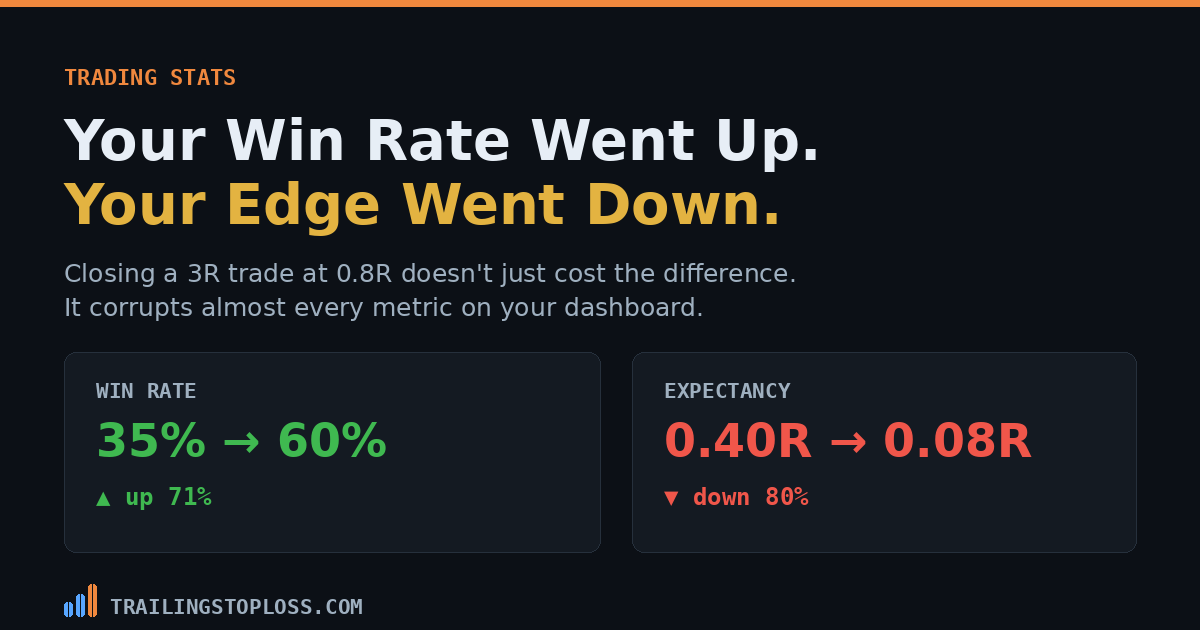
Take a setup that genuinely works: 35% of trades reach 3R if you hold them, the other 65% stop out at −1R. That’s an edge — a positive expectancy of 0.40R per trade. Now assume 60% of your trades trade at least 0.8R in your favour at some point, which necessarily includes every eventual 3R winner. Close all of those at 0.8R instead.
| Metric | Held to 3R | Cut at 0.8R |
|---|---|---|
| Win rate | 35% | 60% |
| Average win | 3.0R | 0.8R |
| Average loss | −1.0R | −1.0R |
| Win/loss ratio | 3.00 | 0.80 |
| Expectancy per trade | +0.40R | +0.08R |
| Break-even win rate needed | 25.0% | 55.6% |
| Cushion above break-even | 10.0 pts | 4.4 pts |
| Profit factor | 1.62 | 1.20 |
| Result over 100 trades | +40R | +8R |
Win rate rose 71%. Expectancy fell 80%. If you judge yourself on the number that improved — and most traders do, because it’s the one that feels like skill — you will conclude you’re getting better at exactly the moment your edge is disappearing.
Cutting winners converts trades that would have lost into trades that win a little. That genuinely raises your win rate. It just costs more than it earns.
Every other metric that breaks
Your break-even threshold moves, and nobody recalculates it
Break-even win rate is 1 ÷ (1 + reward:risk). At 3:1 you need 25%. At 0.8:1 you need 55.6%. A system that was comfortably profitable at 35% becomes marginal at 60%, because the bar moved further than your win rate did. Traders monitor win rate obsessively and almost never re-derive the win rate they actually need — so the cushion can more than halve while the dashboard shows improvement.
You delete the right tail and keep all of the left
The truncation is one-sided by construction. Stops fill in full; targets don’t get the chance. In continuation and trend setups the entire profit lives in the right tail — the 3R and 5R outliers pay for every losing trade in the distribution. Cutting at 0.8R removes the payer and leaves every payment intact.
The exit stops being a property of the strategy
Once the close is discretionary, your sample no longer measures the setup — it measures your comfort level on the day. That makes the data uninterpretable. You can’t backtest against it, can’t compare live to forward test, and can’t answer “does this setup work”. You can only answer “was I relaxed in June”.
Opportunity cost appears in no standard metric
Win rate, profit factor, expectancy, average hold time, Sharpe — none of them has a field for what the trade would have done. The loss is invisible unless you record maximum favourable excursion, the furthest a trade moved in your favour before you closed it. Most journals don’t have that column, which means you can trade a 3R edge into the ground for a year while every number on your dashboard reads fine.
Recovery arithmetic inverts
At 3R, one loss costs a third of a winner. At 0.8R, it costs 1.25 winners — you now need more than one win to undo one loss. Drawdowns get deeper relative to gains and take materially longer to climb out of, while a rising win rate reassures you that nothing is wrong. This is also where cost drag bites hardest: in the Taiwan day-trading data, traders lost around 7 basis points per day gross and 23.9 net, so costs did roughly two thirds of the damage. Smaller wins make every commission a larger fraction of the trade. (Review of Asset Pricing Studies, 2020)
Risk-adjusted metrics improve as returns fall
Truncating the upside reduces the variance of your returns, so anything Sharpe-shaped looks better — smoother equity curve, smaller swings, fewer outliers. You’ve improved the ratio by removing the numerator. Any metric that rewards consistency will applaud this behaviour right up until the account stops growing.
You lose the ability to tell your setups apart
If setup A typically runs to 4R and setup B tops out around 1.5R, capping both at 0.8R makes them statistically identical. Allocation across setups becomes impossible — you’ll size the weak one exactly like the strong one, because your own data says they’re the same.
It hides a regime dependency
Cutting early is nearly free in chop and catastrophic in a trend. Your statistics will therefore suggest a regime-independent edge while your actual P&L is inversely coupled to the environment the setup was designed for. You’ll draw the wrong conclusion about when to trade it.
Position sizing built on planned R is over-sizing
Any sizing rule derived from a 3:1 payoff is wrong for a 0.8:1 realised payoff. You’re carrying risk calibrated to an edge you aren’t actually capturing — which is the specific combination that produces an outsized drawdown from a system you believed was conservative.
Why this particular error is so persistent
Because the behaviour has a name and a substantial literature. Terrance Odean’s study of 10,000 discount brokerage accounts found a strong preference for realising winners over losers — the disposition effect — and it wasn’t explained by rebalancing, transaction costs or taxes. (Odean, 1998)
Crucially, it wasn’t justified by what happened next either: the winners investors sold went on to outperform the losers they held, with later work putting the gap at roughly 3.4% over the following year. Cutting winners isn’t a neutral style preference. It has a measured price tag attached, and it has for nearly three decades. (Gödker, Odean & Smeets)
Several firms enforce a consistency rule capping how much of your total profit any single day may represent. Cutting winners is the fastest way to satisfy it. So the rule you’re trading under actively rewards the exact behaviour that destroys your expectancy — and passing the evaluation can reinforce a habit that makes the funded account harder to keep.
How to see it in your own data
All of this is measurable, and it takes one afternoon. The distortion is only invisible because the field that would expose it usually isn’t recorded. (Odean, 1998)
- Add an MFE column. For each trade, how far did it move in your favour, in R, before you closed it? That single number is the whole diagnosis.
- Compute realised R against planned R. Average both. If your plan says 3:1 and your realised average win is under 1R, the plan is fiction and every projection built on it is wrong.
- Re-run your last fifty trades untouched. What would the original stop and target have produced? Two numbers, one afternoon, and it settles the argument permanently.
- Recalculate your break-even win rate from realised figures, not planned ones. Then compare it to your actual win rate. The cushion between them is your real margin of safety.
- Segment by setup and by regime. Once MFE exists you can finally see which setups have a right tail worth holding for and which genuinely top out early — because some do, and for those, taking 0.8R is correct.
The honest counterweight
Not every early exit is an error. If your MFE data shows a setup rarely exceeds 1.2R, then a 3:1 target was never realistic and the fix is to change the plan rather than force the hold. Scaling out is also a legitimate technique when it’s specified in advance — the problem isn’t taking partial profit, it’s taking it because the screen got uncomfortable. (Journal of Financial Markets)
The distinction is whether the exit was decided before the entry. A pre-planned scale at 1R with a runner to 3R produces clean, interpretable data. An improvised close at whatever the screen said at 10:42 produces a sample nobody can learn from, including you. Same trade, same P&L, completely different information value. (Gödker, Odean & Smeets)
The short version
Closing a 3R trade at 0.8R raises your win rate by around 70% while cutting your expectancy by around 80%, and the metric that improves is the one you’re most likely to be watching. It also moves your break-even threshold from 25% to 55.6%, deletes the right tail while leaving the losing side untouched, makes your sample impossible to backtest, hides the loss from every standard metric, inverts your recovery maths, and flatters any risk-adjusted measure by removing the returns it was supposed to measure. The fix isn’t willpower. It’s an MFE column, a comparison of realised R against planned R, and a break-even win rate recalculated from what you actually did rather than what you intended. (Review of Asset Pricing Studies, 2020)
Frequently asked questions
Why is my win rate high but I’m still not making money?
Most often because you’re closing winners early. Cutting a trade at a fraction of its target converts trades that would have lost into small wins, which genuinely raises win rate — while collapsing your average win. In a worked example, cutting 3R targets at 0.8R lifts win rate from 35% to 60% and drops expectancy from 0.40R to 0.08R per trade. The number that improved is the one most traders watch.
What win rate do I need to break even?
Divide 1 by (1 + your reward-to-risk ratio). At 3:1 you need 25%. At 1:1 you need 50%. At 0.8:1 you need 55.6%. The critical mistake is calculating this from your planned ratio rather than your realised one — if you plan 3:1 and actually take 0.8R, your real break-even bar is more than double what you think it is.
What is MFE and why does it matter?
Maximum favourable excursion is how far a trade moved in your favour before you closed it. It matters because opportunity cost appears in no standard metric — not win rate, not expectancy, not profit factor. Without an MFE column you can trade a genuine 3R edge into the ground for a year while every number on your dashboard looks acceptable. It’s the single field that makes early exits visible.
Does cutting winners early affect my Sharpe ratio?
Yes, and misleadingly so — it usually improves it. Truncating the upside reduces the variance of your returns, producing a smoother equity curve with fewer outliers. Any risk-adjusted measure will reward that, because you’ve improved the ratio by removing the numerator. Metrics that prize consistency will applaud the behaviour right up until the account stops growing.
Is scaling out of a position the same problem?
No, provided it’s specified before entry. A planned scale at 1R with a runner to 3R produces clean, interpretable data and a defined expectancy. The problem isn’t taking partial profit — it’s taking it because the screen became uncomfortable at 10:42. Same P&L, completely different information value, because only one of them can be tested.
Do prop firm rules encourage cutting winners?
Some do, indirectly. Consistency rules that cap how much of your total profit any single day can represent are most easily satisfied by taking smaller, more uniform wins. That means the rule you’re trading under can reward the precise behaviour that erodes your expectancy — and a habit formed passing the evaluation makes the funded account harder to keep.
Related on this site: why managing a trade usually means ruining it · the break-even reflex · ending your day on one good trade · free P&L calendar
The worked example uses illustrative figures to show the mechanism; your own numbers will differ, which is the point of measuring them. Nothing here is financial advice. Futures trading carries substantial risk of loss and is not suitable for every investor.