Day 4 of 30: I Broke the One-Trade Rule, and the Second Trade Cost More Than the First
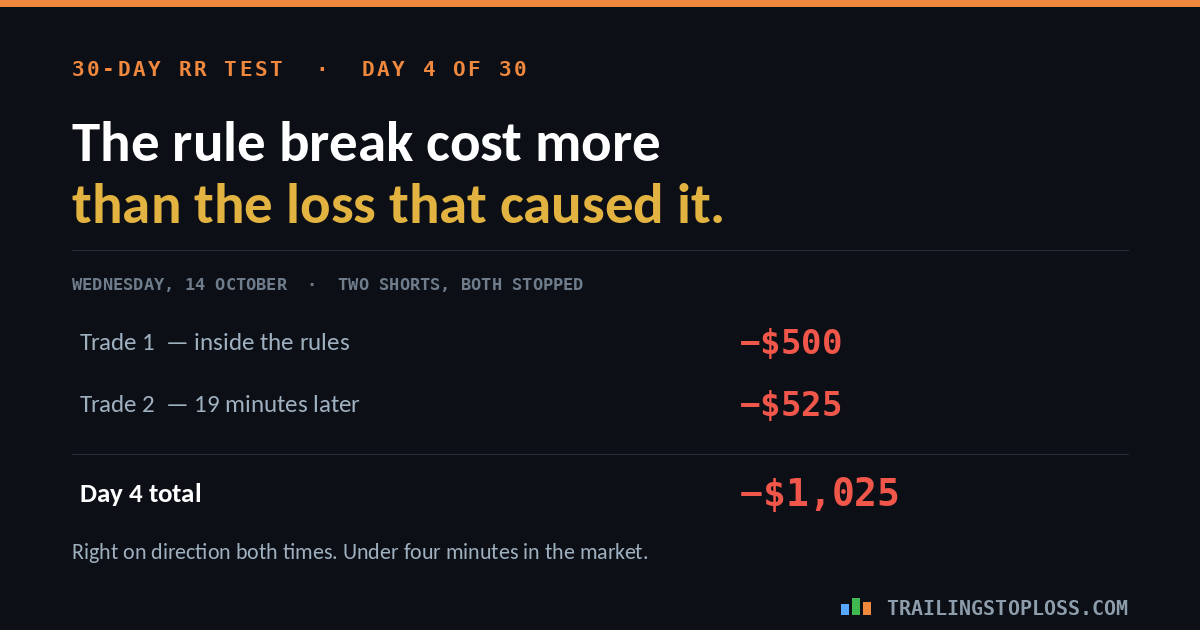
Two shorts on Wednesday morning. Right on direction both times. Stopped out both times, for 51.25 points and $1,025 in under four minutes of actual market exposure. The running balance goes from +$435 to −$590.
The loss is not the interesting part. The order of events is: the trade I took because I was annoyed about the first one cost more than the first one did.
This is day 4 of a pre-registered 30-day test comparing a 1:1, 1:2 and 1:3 exit on the same NQ entry — 100 ticks of risk, one trade a day, first half hour of the session. I took two. So this entry is both a trade log and an account of what the rule I broke was actually for.
The two trades


Both entries were market sells. Both exits were the protective buy stop. Both targets sat as resting buy limits and were cancelled unfilled when the stop took the other side of the bracket. The slippage was unremarkable in both directions: the first stop filled a quarter point better than its trigger, the second filled three quarters of a point worse, for a net cost of ten dollars across the day. That is noise, not a finding, and I am noting it only so nobody has to ask.
Both trades were right. Both were early.
Trade 1 went short at 30,587.25. Forty-one seconds later price printed 30,612.50 and the bracket closed me out. Price then collapsed through 30,512.25 — the 1:3 level for that entry — and kept going to roughly 30,470 inside the same move.
Trade 2 went short at 30,490.75. Price bounced to 30,517.00, took me out, chopped sideways for the better part of an hour, and then broke down to roughly 30,355 on the 10:00 and 10:30 bars. The 1:3 for that entry was 30,414.25. It cleared it by sixty points.
So on both trades the direction was right, the magnitude was far beyond anything I was targeting, and the stop came first anyway. That is now three of five trades in this test with exactly that shape — the same thing that happened on day 2, when all three targets were reached after the stop rather than before it.
When a trade is stopped before it reaches 1:1, the exit rule does not matter. The 1:1, the 1:2 and the 1:3 all produce the identical loss. Three of my five trades so far have ended that way. Whatever this test eventually says about target width, the variable that has decided most of my results is not the target at all. It is where I got in.
Why “just widen the stop” is the wrong answer
My first instinct on Wednesday evening was that a 25-point stop is too tight for the open. It is a tempting conclusion, because it would have worked. A 35-point stop survives both of Wednesday’s trades and both would have gone on to pay at 1:3.
Here is the problem with that reasoning. Look at what the market was actually doing between 8:50 and 10:00: it traded roughly 30,470 to 30,520. That is a band about fifty points wide. I brought a twenty-five point stop to it, twice, and I entered near the bottom of the band both times.
Inside a range twice as wide as your stop, direction stops being the thing that decides the trade. Whichever edge of the range gets touched first decides it. I was not wrong about where price was going. I was wrong in assuming it would go there without first visiting the other side of the room — and with a stop half the width of the room, that visit is fatal every time.
Widening the stop to 35 points fixes Wednesday the way a bigger wallet fixes overspending. It also makes every future loss forty percent more expensive. On a 1:1 framework that means the win rate has to rise just to stand still, and nothing in Wednesday’s trades gives me any reason to believe it would. Changing one number in a system changes all of them, which is the entire reason this test was pre-registered with fixed parameters in the first place.
The measurement that actually answers “is my stop too tight” is maximum adverse excursion — how far each trade went against me before it did whatever it did next. A stop is too tight when winners are routinely dying inside their own noise, and you can only know that by logging the worst point of every trade, including the ones that won.
I have not been recording it. I can bound Wednesday’s two trades from the order log — at least 25.25 and at least 25.50 points against, since both stops triggered — but “at least” is not a measurement, and for days 1 through 3 I have nothing at all. From day 5 the log gets an MAE column. In twenty-six more trades that is a number I can actually test the stop against, instead of a hunch I formed on an evening when I was annoyed.
The second trade cost more than the first
Trade 1 lost $500. Trade 2 lost $525. Nineteen minutes separated the stop on the first from the entry on the second, the direction was the same, and the entry was a market order.
I do not particularly want to call that a revenge trade, because at the time it did not feel like one. It felt like being right and having been treated unfairly about it, which is a far more comfortable story and leads to precisely the same place. The tell is not the emotion. The tell is the clock: nineteen minutes, same side, straight to market.
The one-trade-a-day rule did not fail on Wednesday. It was never in the room. That rule exists for exactly the twenty minutes after a stop-out, which is the only window in which it ever costs you anything to follow — and consequently the only window in which anyone is tempted to drop it. A rule you only keep when keeping it is free is not a rule, it is a preference. I have written about the mirror image of this, the way a good day talks you into sizing up; this is the same mechanism with the sign flipped.
The arithmetic is unkind in a useful way. Had I followed my own framework, Wednesday is a $500 day and the running balance sits at −$65. Instead the balance is −$590. The rule break accounts for more of the damage than the trade that provoked it.
Where the three strategies stand after four days
| Day | Take 1:1 | Hold 1:2 | Hold 1:3 | What happened |
|---|---|---|---|---|
| 1 — 9 Oct | +$500 | −$500 | −$500 | Reached 1:1, reversed hard |
| 2 — 12 Oct | −$565 | −$565 | −$565 | Stopped first; all levels reached later |
| 3 — 13 Oct | +$500 | +$1,000 | −$505 | Reached 1:2, stopped before 1:3 |
| 4 — 14 Oct | −$1,025 | −$1,025 | −$1,025 | Two trades, both stopped before 1:1 |
| Running | −$590 | −$1,090 | −$2,595 | — |
| Hit rate | 2 of 5 | 1 of 5 | 0 of 5 | — |
Note what day 4 does to the table: all three columns are identical. That is the second time in four days the exit rule has been irrelevant to the outcome, and it is why the gap between the columns is widening much more slowly than the losses are accumulating. Four days in, all three strategies are underwater and the narrow target is losing the least — which is what you would expect from a four-day sample and tells you essentially nothing yet.
The sizing problem this week exposed
There is a second finding here that has nothing to do with risk-reward, and it is arguably more important than anything above.
I am running this test on one full-size NQ contract. At $20 per point, a 25-point stop risks $500 a trade. My own sizing rule is twenty-five losing trades of room inside the drawdown, which at $500 a trade requires $12,500 behind it.
No prop account I cover has that. A FundedNext Flex 50K carries a $1,500 maximum loss — three trades of room. Wednesday alone would have consumed sixty-eight percent of it, and the account would have breached on the next trade regardless of what that trade did. Even the 150K, at $4,000, gives eight trades.
On the micro contract the picture inverts completely. MNQ is $2 per point, so the same 25-point stop risks $50, and a $1,500 drawdown holds thirty of them at CME’s published contract values. Same strategy, same percentage outcomes, an account that can actually survive the sample size the strategy needs.
Which means the test as currently designed is being run at a size that no account it is meant to inform could hold. That is an argument for moving the remaining twenty-six days to MNQ. It changes nothing about the risk-reward question — contract size is a pure scalar and every ratio in the table above is identical either way — but it makes the equity curve a thing a funded trader could actually live through rather than a thing that breaches on day four.
The honest limits
- Five trades. Not five days, five trades. Nothing in the table is evidence of anything. A 2-of-5 hit rate has a confidence interval you could drive a truck through, and I would be the first to take someone else apart for publishing it as a result.
- The MAE figures are bounds, not measurements. I know both trades went at least as far against me as the stop, because the stop triggered. How much further is a chart reading, and chart readings are how people convince themselves of things.
- The fifty-point range is one morning. I have not checked whether Wednesday’s range was typical for the first ninety minutes or unusually wide. That check matters and I have not done it.
- The 1:2 and 1:3 columns are reconstructed from the subsequent price path, not from filled orders. A resting limit at a level is not the same as price trading through it, particularly in fast conditions.
- Day 4 is a contaminated observation. Two trades in a one-trade-a-day design is a protocol violation, and I am reporting it in full rather than dropping it. Discarding the days you handled badly is how a mediocre strategy acquires a beautiful equity curve and an edge that does not exist.
- Demo account. Fills are optimistic by construction and the emotional weight of a $1,025 day is not what it would be on a funded account — which, given that I broke a rule anyway, is not a reassuring thought.
The short version
- Two shorts on Wednesday, both correct on direction, both stopped before 1:1, both followed by moves well past 1:3.
- 51.25 points, $1,025, under four minutes of market exposure. Balance +$435 → −$590.
- The second trade — the one the rules forbade — lost more than the first.
- The market was ranging about fifty points. My stop was twenty-five. Inside a band twice your stop, the first edge touched decides the trade, not your read.
- Widening the stop is the obvious fix and the wrong one on this evidence. The missing measurement is maximum adverse excursion, which I am logging from day 5.
- Three of five trades were stopped before 1:1, which means the exit rule was irrelevant to most of the results so far. The entry is doing the damage.
- At $500 risk per trade on full-size NQ, no prop account I cover could survive this test. The remaining days belong on MNQ.
Frequently asked questions
Why report a day that broke your own rules instead of leaving it out?
Because the rule break is the most informative thing that happened all week, and because dropping inconvenient observations is the single most common way a losing strategy gets published as a winning one. A test you only report when you behave is a test of nothing. Day 4 stays in the sample and stays in the running total.
Wasn’t the problem just bad luck on the slippage?
No. The first stop filled a quarter point better than its trigger and the second filled three quarters worse, for a net cost of ten dollars on a $1,025 day. Slippage accounted for under one percent of the damage. Blaming it would be a way of not looking at the entries.
If both trades eventually went past 1:3, doesn’t that prove the stop was too tight?
It proves the stop was too tight for those two trades, which is a conclusion available only after the fact. The question that matters is whether a wider stop is better across the whole distribution, including every future trade where the wider stop simply loses forty percent more. Answering that needs maximum adverse excursion logged across a real sample, not two examples selected by the fact that they annoyed me.
Why does it matter that the stop was half the width of the range?
Because it converts a directional trade into a coin flip on sequencing. If price is oscillating across a fifty-point band and your stop is twenty-five points from entry, then unless you enter at the very edge of the band, both your stop and your target sit inside normal rotation. Which one price reaches first has very little to do with where price is ultimately headed.
Does switching to MNQ invalidate the first four days?
No. Contract size is a pure multiplier: every point figure, ratio and hit rate in the table stays identical, and only the dollar column rescales by a factor of ten. The reason to switch is survivability, not measurement — a $500-per-trade risk cannot be run on a $1,500 drawdown, and a test whose results no reader could reproduce on a real account is not much use to anyone.
Related on this site: the 30-day test method · day 3 · day 2 · day 1 · the no-edge baseline
All prices and timestamps are taken from the broker order log for CME_MINI:NQ1! on 14 October 2026; times are US Central. Dollar figures assume one full-size NQ contract at $20 per point. Outcomes for the 1:2 and 1:3 targets, and all range and post-stop price figures, are read from the subsequent price path rather than from filled orders. Maximum adverse excursion figures are lower bounds implied by the stop triggers, not measurements. Demo account. Five trades is a log, not evidence. Nothing here is financial advice. Futures trading carries substantial risk of loss.


