The ORB Strategy and Its Statistics: What the Published Numbers Actually Say
The opening range breakout is the most-backtested day trading strategy in existence, and the statistics people quote for it don’t survive being read carefully. The largest public dataset reports a 52.9% win rate in its headline and 35.1% in its own aggregate — a seventeen-point gap caused by how the average was taken. The index-futures numbers that circulate come from samples as small as six trades.
This isn’t an argument that the ORB doesn’t work. It’s what you need to know before quoting a number at it.
The strategy, stated properly
Mark the high and low of the first N minutes after the cash open — most commonly 5, 15 or 30. When price breaks either boundary, enter in that direction. Stop goes on the opposite side of the range or at a fixed distance; target is a multiple of risk or the range width projected from the break.
The logic is that the opening range represents the session’s initial agreement on value, and a decisive break of it signals that one side has won. Overnight positioning unwinds, institutional orders hit, and the day’s direction resolves. It’s intuitive, it’s easy to code, and it has been tested more than almost any other setup — which is precisely why the quality of the testing matters.
| Variant | Range | Typical use |
|---|---|---|
| 5-minute ORB | 09:30–09:35 ET | Highest frequency, most noise |
| 15-minute ORB | 09:30–09:45 ET | The common compromise |
| 30-minute ORB | 09:30–10:00 ET | Fewest signals, widest range |
The biggest published dataset, and its two different answers
The most-cited public ORB research covers 190,460 trades across 611 stocks and ETFs. Its headline table reports average win rates by range length:
| Opening range | Reported win rate | Reported expectancy |
|---|---|---|
| 5-minute | 52.2% | 0.028R |
| 15-minute | 52.5% | 0.004R |
| 30-minute | 52.9% | 0.019R |
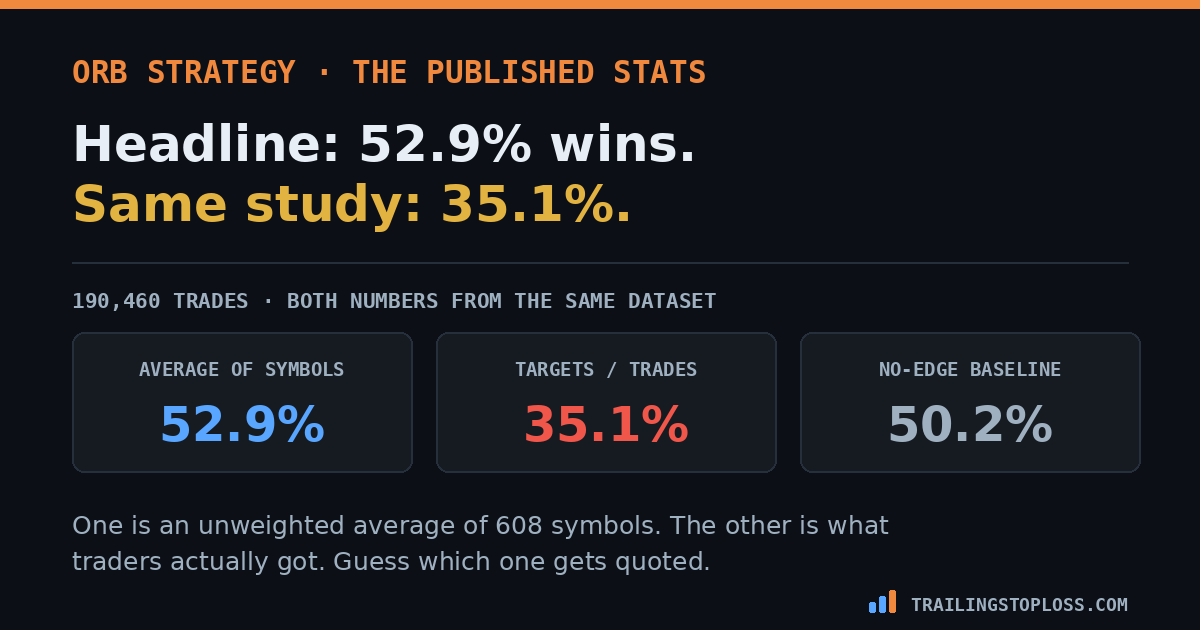
Those are the numbers that get quoted. But the same page also reports the aggregate: 66,868 targets hit out of 190,460 trades — 35.1%. (ORB Setups)
The 52.9% is an unweighted average of per-symbol win rates. Every symbol counts once regardless of whether it produced 20 trades or 2,000. Since low-volume symbols produce extreme rates in both directions and there are far more of them, the average drifts toward the middle while the aggregate reflects what traders actually experienced. The page says so itself, attributing the gap to high-trade-count symbols having lower win rates. The headline and the lived result are different statistics, and only one of them is what happens to your account.
Look at the expectancy column too. Even taking the generous numbers at face value, 0.004R to 0.028R per trade is statistically indistinguishable from zero — and the dataset doesn’t state whether commissions or slippage were included, or what stop and target rules produced the figures.
The top performers are a sorting artifact
The same research lists its best symbols: TSLT at 96% across 26 trades, GME at 95% across 20.
Run the confidence intervals and those two are genuinely above chance in isolation. But that’s not the question. The question is what happens when you sort 611 symbols by win rate and look at the top — with that many candidates, extreme results at 20-odd trades are what you’d expect from noise alone. It’s the same reason a fund family launches ten funds and advertises the one that beat the market.
The usable version of that table isn’t “trade TSLT.” It’s “any symbol-level result here with fewer than a few hundred trades tells you nothing.”
The index futures numbers are worse
Most ORB research is on stocks. For futures traders the published samples get thin fast. One index study reports:
| Reported result | Rate | 95% interval | Separates from a coin flip? |
|---|---|---|---|
| S&P short, 5 of 6 | 83% | 44–97% | No |
| Dow short, 7 of 8 | 88% | 53–98% | Barely |
| NASDAQ long, 1 of 3 | 33% | 6–79% | No |
| Russell long, 1 of 4 | 25% | 5–70% | No |
Its 30-day results are better sampled but the trade counts aren’t published. The conclusion it reaches is the part worth carrying: with a 30-minute range, a stop and target at half the range width, the Dow and S&P showed positive P&L while NASDAQ came out negative and Russell was marginal. It also found that wider stops, wider targets and wick-touch entries all made results worse. (ToS Indicators)
That NASDAQ result deserves more attention than it gets. It’s the instrument most retail futures traders use, and the one index test with published rules found it was the weakest of the four.
What all of it has to beat
Here’s the context missing from every one of these studies. Simulating 40,000 sessions where the opening range carries no information at all, a break still reaches 1:1 before its stop 50.2% of the time, travels 2R on 18.5% of attempts and 3R on 4.9%.
| Figure | Rate | Reading |
|---|---|---|
| No-edge baseline at 1:1 | 50.2% | What noise produces |
| Published headline | 52.9% | +2.7 over noise |
| Same study’s aggregate | 35.1% | Below noise |
The headline sits 2.7 points above the baseline — and distinguishing a genuine 55% from 50% takes roughly 1,630 trades, so 2.7 points is well inside the margin where you can’t tell edge from variance without an enormous sample and matched rules.
What to actually do with the ORB
None of this means delete it from your platform. It means treat it as an untested hypothesis rather than a validated strategy, and test it the way it hasn’t been.
- Pick one instrument and one range length. Results differ by market — the one index study found S&P and Dow positive and NASDAQ negative. Cross-market averages hide that.
- Measure maximum favorable excursion, not just win rate. How far the move travels answers the target question for every width at once, which is the design the 30-day test here uses.
- Log your actual fill, not the level. Booking entries at the range boundary rather than where the break executed inflates results by about two percentage points on its own.
- Include costs before you conclude anything. At a 0.02R headline expectancy, a $2.00 round trip on a $50 risk is twice the entire edge.
- Test a condition, not the raw signal. The honest open question isn’t whether breakouts work — the raw signal is close to noise — but whether they work on a subset: wide range versus narrow, with the overnight trend or against it, second break rather than first.
The honest limits
Absence of good evidence is not evidence of absence. Nothing here demonstrates the ORB doesn’t work. It demonstrates that the public statistics are weaker than their presentation suggests, which is a claim about the evidence rather than the strategy.
I have not backtested this on NQ. The baseline figure is from a null model, and the published results are other people’s, read 13 October 2026. I’ve reported their numbers as stated and shown the arithmetic on top.
And the sources differ in rules, instruments and periods, so the figures here are not directly comparable with each other. That’s part of the problem rather than a flaw in the comparison — there is no standard ORB specification, which is one reason the published numbers scatter so widely.
The short version
The opening range breakout marks the high and low of the first 5, 15 or 30 minutes and trades the break. The largest public dataset covers 190,460 trades across 611 symbols and reports 52.2% to 52.9% win rates by range length — but its own aggregate is 66,868 targets hit of 190,460 trades, or 35.1%, because the headline is an unweighted average of per-symbol rates and the aggregate is what traders got. Its best symbols, TSLT at 96% and GME at 95%, come from 26 and 20 trades out of a 611-symbol scan. Index futures evidence is thinner still: published samples of 5 of 6 and 1 of 3, with the one test that broke out markets finding Dow and S&P positive and NASDAQ negative. Against a simulated no-edge baseline of 50.2% at 1:1, the 52.9% headline is 2.7 points clear — inside the margin where roughly 1,630 trades are needed to tell edge from variance. Treat the ORB as an untested hypothesis, pick one instrument, measure excursion rather than win rate, log real fills, and include costs.
Frequently asked questions
What is the win rate of the opening range breakout strategy?
It depends which number you take from the same study. The largest public dataset, covering 190,460 trades across 611 symbols, reports 52.2% for a 5-minute range, 52.5% for 15-minute and 52.9% for 30-minute — but those are unweighted averages of per-symbol rates. The same dataset’s aggregate is 66,868 targets hit out of 190,460 trades, or 35.1%. The aggregate reflects what traders actually experienced; the headline does not.
Does the ORB strategy work on NASDAQ futures?
The one published index study with stated rules found it didn’t. Testing a 30-minute opening range with a stop and target at half the range width, it reported positive P&L on the Dow and S&P 500, marginal results on the Russell, and negative results on the NASDAQ. Most ORB research is conducted on stocks rather than index futures, so evidence specific to NQ is thin, and the sample sizes behind the index figures are small or unstated.
Which opening range length is best — 5, 15 or 30 minutes?
The published differences are too small to act on. The largest dataset reports 52.2%, 52.5% and 52.9% for 5, 15 and 30-minute ranges respectively — a spread of 0.7 percentage points, against a no-edge baseline of about 50.2% and a sample requirement of roughly 1,630 trades to distinguish a 5-point difference reliably. Choosing between them on those figures is choosing between numbers that haven’t been separated from noise.
Why do ORB backtests look better than live results?
Several reasons compound. Entries booked at the range boundary rather than the actual fill inflate results by roughly two percentage points, because the level is where an order triggers rather than where it executes. Costs are frequently excluded, and at a published expectancy of 0.02R a $2.00 round trip on $50 of risk exceeds the entire edge. And symbol-level results drawn from scans of hundreds of candidates surface outliers that won’t repeat.
Should I trade the opening range breakout?
Treat it as a hypothesis to test rather than a validated strategy. The raw signal sits close to what no edge produces, so the useful question is whether it works under a specific condition — a wide range versus narrow, aligned with the overnight trend, the second break rather than the first. Test one instrument and one range length, log your actual fills, record how far each move travels rather than only whether it won, and include costs before drawing any conclusion.
Related on this site: the no-edge baseline for breakouts · the 30-day 1:1 vs 1:2 vs 1:3 test · what slippage cost on a live entry · add a contract, don’t move the target
Published figures are quoted as stated by their sources, read 13 October 2026; confidence intervals are Wilson intervals calculated from the reported counts. The no-edge baseline comes from 40,000 simulated sessions of a driftless random walk and is not a backtest of any instrument. Sources differ in rules, instruments and periods and are not directly comparable with one another. Nothing here is financial advice. Futures trading carries substantial risk of loss.