Watching Your P&L Is Costing You Money
There’s an experiment where the only thing that changed between groups was how often people saw their results. The group that saw them most took the least risk and made the least money — and professional traders turned out to be worse at this than students.
Your platform puts unrealized P&L in front of you by default, updating every tick. That’s a design decision, and it has a measurable cost.
The experiment
In 1997, Thaler, Tversky, Kahneman and Schwartz published a test in the Quarterly Journal of Economics. Participants allocated between a risky and a safe asset, learning from experience as they went. The only variable manipulated was feedback frequency — how often each group saw how their investments were doing.
The abstract states the result without hedging: the investors who got the most frequent feedback, and therefore the most information, took the least risk and earned the least money. (Thaler, Tversky, Kahneman & Schwartz, QJE)
Gneezy and Potters ran an independent version the same year with a sequence of identical lotteries, differing only in whether participants played round by round or in blocks of three. Same finding: the more frequently returns were evaluated, the more risk-averse people became. (Gneezy & Potters, QJE)
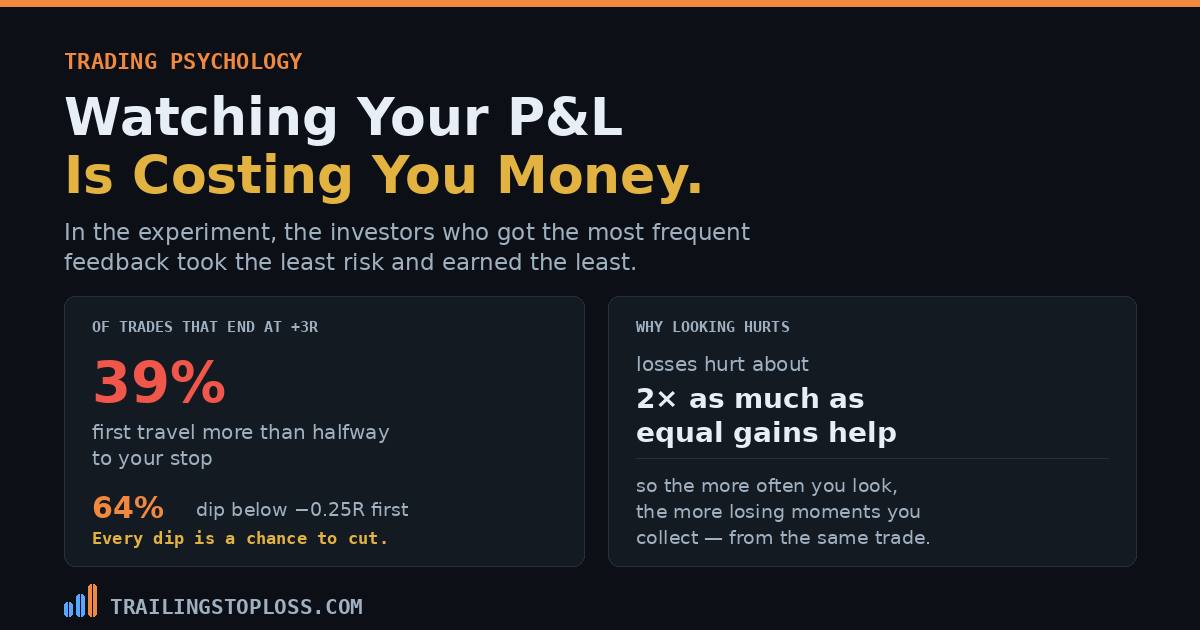
The name for it is myopic loss aversion — two things combining. Losses register roughly twice as strongly as equivalent gains, and outcomes get evaluated frequently rather than as a whole. Neither alone does much damage. Together they mean that every additional look is another chance to experience a loss, and losses count double. (BehavioralEconomics.com)
Haigh and List ran the same style of experiment on professional futures and options traders from the CBOT, published in the Journal of Finance. The professionals didn’t show less myopic loss aversion than students. They showed more. Experience did not immunize them — plausibly because their working environment trains them to check constantly. (Haigh & List, via NBER)
Why this hits futures traders harder than investors
Most writing about myopic loss aversion concerns retirement accounts — check your 401(k) monthly instead of daily and you’ll hold more equities. The mechanism is worse for an intraday trader, because your evaluation frequency isn’t monthly or daily. It’s whatever your eyes do.
Here’s the specific problem. A trade that eventually wins does not travel in a straight line to your target. Simulate a position that resolves at either +3R or −1R, calibrated so 35% of them win, and look at what the winners do on their way there.
| Of trades that finish at +3R… | |
|---|---|
| Dipped below −0.25R at some point first | 64% |
| Traveled more than halfway to the stop (−0.50R) | 39% |
| Went below −0.75R — three quarters of the way to being stopped | 18% |
| Median deepest point before working | −0.38R |
| Median share of the hold spent below entry | 7% |
Nearly two in five of your winning trades will first travel more than halfway to your stop. Every one of those is a moment where the screen says you’re wrong, and every one is an opportunity to close.
This is the mechanism behind cutting winners early
We’ve covered elsewhere what closing a 3R trade at 0.8R does to your statistics — win rate rises about 71% while expectancy falls about 80%. What that article didn’t explain is why traders do it so consistently.
This is why. Cutting winners isn’t primarily greed or impatience. It’s the accumulated weight of watching a position that keeps showing you red moments, with each one hurting twice as much as the green ones feel good. The urge to take 0.8R and be done isn’t irrational given the experience — it’s a rational response to an experience you manufactured by looking.
Which also means the fix isn’t more discipline at the moment of exit. It’s fewer moments.
Prop dashboards are built to maximize this
Worth naming, because it isn’t accidental. A typical prop firm dashboard displays real-time unrealized P&L, current drawdown, distance to the trailing threshold, and progress toward the profit target — all updating live. That’s four separate loss-relevant readouts refreshing continuously.
And with an intraday trailing drawdown, checking isn’t purely optional. The threshold moves with your peak equity, so there’s a legitimate reason to know where you stand. That’s a real conflict rather than a psychological failing: the account structure requires the monitoring that the research says degrades your decisions. See how daily loss limits and trailing drawdown actually work.
What to do about it
The interventions here are structural, and unusually cheap — you’re changing what’s visible, not trying to feel differently about it.
- Hide the unrealized P&L column. Most platforms allow it. The stop and target are already placed; watching the number between them adds no information you can act on, only evaluations you’ll react to.
- Watch price, not money. If you need the chart open, look at the level rather than the dollar figure. “Is my thesis still valid” is a different question from “am I up or down”, and only one of them should move you.
- Use alerts instead of attention. An alert at your invalidation level does the monitoring job without the continuous feedback. This is the direct implementation of the finding.
- Evaluate at the day or week, not the trade. Bundling is the lever the experiments actually pulled — participants who saw results in blocks took more risk and earned more. A daily P&L in a calendar is one evaluation; a live figure is thousands.
- If you must check a prop dashboard, check on a schedule. Once at a fixed time rather than continuously. That preserves the drawdown safety function while cutting the evaluation count by orders of magnitude.
More information is normally better. This is the rare case where it isn’t — because the extra information arrives faster than it changes anything you’d do, while still triggering the loss response every time. The traders in the experiment who saw the least were not less informed about anything that mattered. They just experienced fewer losses on the way to the same outcome.
The honest limits
Three caveats worth stating.
This is lab research. The core experiments are controlled allocation tasks, not live futures trading, and the Haigh and List work with CBOT professionals is the closest thing to a field test rather than an actual one. The effect is well replicated across settings, but the size of it in your trading is not something anyone has measured.
Some monitoring is genuinely necessary. An intraday trailing drawdown account can be breached by a spike while the trade is still open, and news can invalidate a thesis mid-position. The argument is against continuous evaluation of the money, not against situational awareness.
And less risk isn’t always worse. The experiments measured earnings in a setting with a known positive edge, where taking more risk paid. If your edge is unproven, the frequent-feedback group’s caution isn’t obviously a mistake — it just means you’re solving a different problem, which is whether the edge exists at all. (Thaler et al., QJE)
The short version
In a controlled experiment where the only variable was feedback frequency, the investors who saw their results most often took the least risk and earned the least money — and professional futures traders tested later showed the effect more strongly than students, not less. The mechanism is myopic loss aversion: losses register about twice as heavily as equivalent gains, so every additional glance is another chance to collect one. It hits intraday traders hardest because winning trades don’t travel in straight lines — with a 35% win rate at 3:1, 64% of eventual winners first dip below −0.25R and 39% travel more than halfway to the stop. Each of those is a moment the screen tells you you’re wrong, and each is an opportunity to cut, which is the actual mechanism behind cutting winners early. The fix is structural rather than motivational: hide unrealized P&L, watch price instead of money, use alerts, and evaluate by the day or week rather than the tick. (Thaler, Tversky, Kahneman & Schwartz)
Frequently asked questions
Does watching your P&L really make you a worse trader?
The controlled evidence says frequent feedback reduces risk-taking and earnings. In the 1997 experiment by Thaler, Tversky, Kahneman and Schwartz, the only manipulated variable was how often participants saw their results, and the most-frequent group took the least risk and earned the least. Gneezy and Potters found the same independently. The effect is called myopic loss aversion, and a later study of professional CBOT traders found they exhibited it more strongly than students.
What is myopic loss aversion?
Two things combining. Loss aversion means losses register roughly twice as strongly as equivalent gains. Frequent evaluation means outcomes are assessed one at a time rather than as a whole. Alone, neither does much. Together, every additional look becomes another opportunity to experience a loss that counts double — so the more often you check, the less risk you’re willing to hold, even when holding is the profitable choice.
Should I hide my unrealized P&L while in a trade?
It’s the single cheapest change this research supports. Your stop and target are already placed, so the number between them provides no information you’d act on — only repeated evaluations you might react to. Watch price and your invalidation level instead, and use alerts rather than attention. The exception is an intraday trailing drawdown account, where knowing your position genuinely matters; there, check on a fixed schedule rather than continuously.
Why do I keep cutting winners early?
Partly because your winners spend real time looking like losers. Simulated at a 35% win rate on a 3:1 setup, 64% of eventual winners first dip below −0.25R and 39% travel more than halfway to the stop. If you’re watching continuously you experience every one of those moments, each weighted about double, and closing for a small gain becomes a rational response to that accumulated experience. Fewer glances means fewer of those moments.
How often should I check my trading results?
Less often than your platform encourages. The experiments found that bundling outcomes — evaluating in blocks rather than one at a time — increased both risk-taking and earnings. Practically that means a daily or weekly review rather than a live per-tick figure. A P&L calendar you fill in at the end of the day is one evaluation; an open platform with unrealized P&L visible is thousands of them.
Do prop firm dashboards make this worse?
Structurally, yes. A typical dashboard shows unrealized P&L, current drawdown, distance to the trailing threshold and progress to target, all updating live — four loss-relevant readouts refreshing continuously. And with an intraday trailing drawdown, checking isn’t entirely optional, since the threshold moves with peak equity. That’s a genuine conflict between the account structure and good decision-making rather than a personal weakness, and the workable compromise is scheduled checks instead of continuous ones.
Related on this site: what cutting winners early does to your stats · why managing a trade usually means ruining it · daily loss limits and trailing drawdown · free P&L calendar
Excursion figures come from 20,000 simulated trades calibrated to a 35% win rate at 3:1; real markets are not random walks, so treat them as an illustration of the mechanism rather than a forecast. Nothing here is financial advice. Futures trading carries substantial risk of loss.


