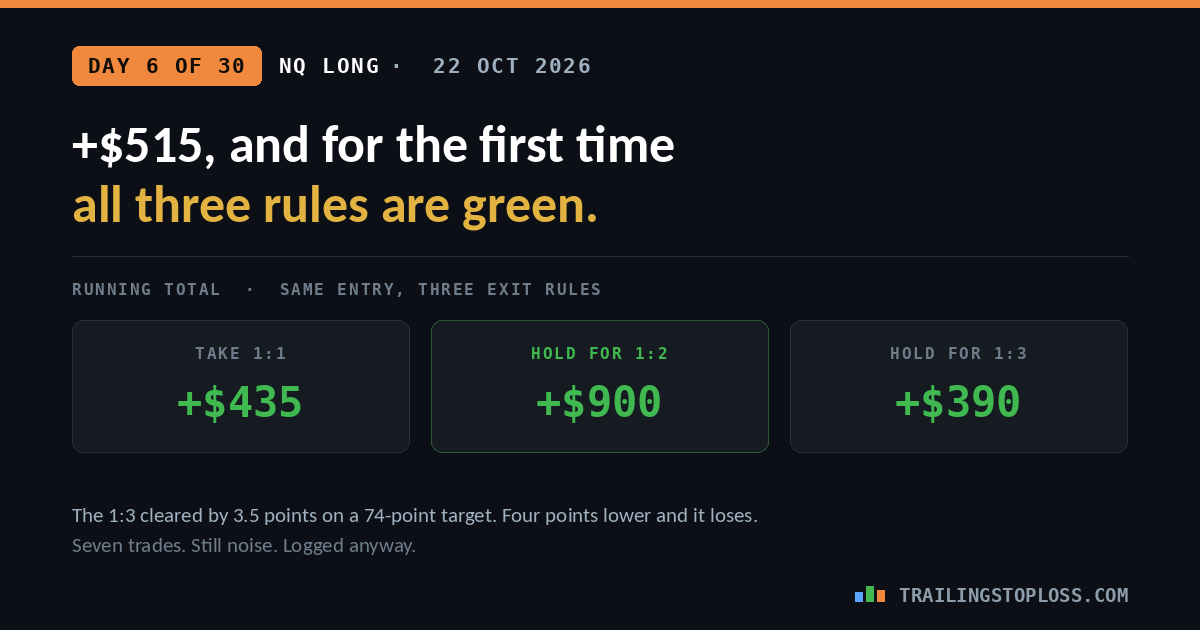
Day 6 of 30: +$515 on the First Long, and All Three Exit Rules Turn Green
Price had been rejecting a level repeatedly. The continuation entry went long at 29,503.75 and the target filled 49 seconds later at 29,529.50 for $515, with VWAP as the draw. Price carried well through the 1:3 level at 29,578.00, putting all three running totals above water for the first time in the test.
It is also the second day running where holding for 1:3 would have been right. That column was $1,095 down on Tuesday. It is $390 up today.
The trade


The setup, and what I was actually reading
Price had been rejecting a level repeatedly through the early session. That repetition is the context, not the signal — what makes it tradeable is the resumption afterwards, which is the same continuation entry used on every trade in this test. Wait for the move to establish, enter on the continuation of it, rather than trying to pick the turn.
The draw was VWAP above. That gave the trade somewhere to go that was not simply “a number of points away from my entry,” which is worth separating out: the 1:1 target is a measurement decision imposed by the test design, while VWAP was the reason to believe there was room above the entry at all. The test is not asking whether VWAP is a good target. It is asking what happens to the same entry under three different exit rules, and the entry logic lives underneath all three of them.
Slippage in both directions on the same trade
This one is a useful specimen because it slipped twice, in opposite directions, for mechanically different reasons.
The entry was a buy stop at 29,502.75 that filled at 29,503.75 — a full point against me, $20. That is what a stop order does when it triggers into a move that is already going: the order becomes a market order and takes whatever the book offers. Entering on continuation means entering into momentum by definition, so this is not bad luck, it is the structural cost of the entry type. Worth budgeting for rather than complaining about.
The exit was a resting limit at 29,528.75 that filled at 29,529.50, three quarters of a point in my favor, $15. That is the opposite mechanism: a limit order sitting in a fast market gets filled at or better than its price, never worse.
Net cost for the day, a quarter of a point. Five dollars. The point is not the money — it is that the two order types behave differently under the same conditions, and a test that logs only the net figure would hide a cost that recurs on every single entry.
All three levels cleared
Risk on the trade was 24.75 points measured from the actual fill, so the three levels sat at 29,528.50, 29,553.25 and 29,578.00. Price traded through all three.
| Target | Level | Reached? | Result |
|---|---|---|---|
| 1:1 | 29,528.50 | Yes — filled at 29,529.50 | +$515 |
| 1:2 | 29,553.25 | Yes | +$990 |
| 1:3 | 29,578.00 | Yes, clearly | +$1,485 |
Today’s 1:3 cleared with room, which is the comfortable case. It is not the usual one. Every 1:2 and 1:3 figure in this series is read off a chart rather than taken from a fill, and the gap between a win and a loss in those columns is frequently a handful of points of someone else’s buying — on day 3 a near-miss at 1:3 is what put that column $505 down while the 1:2 banked $1,000 on the same trade.
One misread wick is worth up to $2,970 in a single column. Anyone treating the running table below as a verdict should weigh that before the numbers.
Where the three strategies stand
| Day | Take 1:1 | Hold 1:2 | Hold 1:3 | What happened |
|---|---|---|---|---|
| 1 — 9 Oct | +$500 | −$500 | −$500 | Reached 1:1, reversed hard |
| 2 — 12 Oct | −$565 | −$565 | −$565 | Stopped first; all levels reached later |
| 3 — 13 Oct | +$500 | +$1,000 | −$505 | Reached 1:2, stopped before 1:3 |
| 4 — 14 Oct | −$1,025 | −$1,025 | −$1,025 | Two trades, both stopped before 1:1 |
| 5 — 20 Oct | +$510 | +$1,000 | +$1,500 | Cleared all three targets |
| 6 — 22 Oct | +$515 | +$990 | +$1,485 | First long; cleared all three targets |
| Running | +$435 | +$900 | +$390 | — |
| Hit rate | 4 of 7 | 3 of 7 | 2 of 7 | — |
Three things moved today. Every column is above water for the first time. The 1:2 has taken the lead, $465 clear of the 1:1, having been $500 behind it five days ago. And the 1:3 has gained $2,985 across two sessions from a standing start of −$1,095.
The 1:2 column’s entire advantage was built on days 5 and 6. Remove either one and it is behind again. A single day-4-shaped session — two stops, no target reached — erases roughly the whole margin.
Seven trades in, what the table shows is not which rule is better. It shows that two consecutive trending days flatter wide targets, and that four days ago two consecutive chopping trades flattered narrow ones. Thirty trades is not enough to settle this either. It is just enough to stop any single day from owning the answer.
The MAE column, day two of not existing
Day 4 committed to logging maximum adverse excursion from day 5. Day 5 did not have it. Today does not have it either.
The stop at 29,479.00 was never approached and the trade was in profit almost immediately, so the true figure is probably a point or two. But this is now the second consecutive entry where I have written “probably,” and the whole reason for wanting the column is that the stop-width question cannot be answered with adjectives. Two trades of missing data in a thirty-trade sample is not fatal. Ten would be.
The fix is mechanical rather than motivational: record the extreme against the position from the chart before closing the platform, not reconstruct it in the evening from a screenshot taken for a different purpose.
The honest limits
- Seven trades. Four winners. The 1:2 lead is $465 and a single bad day is worth roughly a thousand in that column.
- The 1:3 outcome is a chart read, not a fill. Price trading through a level and a resting limit being filled at it are different events, and reading a high off a screenshot is easy to get wrong — a last-price marker and a session high look identical at a glance. Treat every reconstructed figure in this series as carrying that uncertainty.
- No MAE recorded, for the second consecutive trade.
- The 1:2 and 1:3 outcomes are reconstructed from the price path, not from filled orders. Today’s exit filled better than its limit, which suggests orderly conditions, but a limit sitting 74 points away is a different proposition from one sitting 25 away.
- Risk was 24.75 points, not the nominal 25, because the entry slipped a point. All three levels and all three dollar figures are calculated from the real fill rather than the intended one, which is why today’s numbers are not round.
- Demo account, still at one full-size NQ contract, still a risk level no prop account in this test’s price range could survive.
The short version
- First long of the test. Continuation entry after repeated rejection, VWAP above as the draw.
- Buy stop slipped a point against me on entry; the resting limit filled three quarters of a point in my favor on exit. Net cost, five dollars.
- +25.75 points, +$515, held 49 seconds.
- Price traded through the 1:3 at 29,578.00 with room to spare — the second consecutive day that column has paid.
- All three running totals are positive for the first time: 1:1 +$435, 1:2 +$900, 1:3 +$390.
- The 1:2 leads for the first time, and its entire lead was built on the last two sessions.
- MAE still not logged, two trades running.
Frequently asked questions
Why did the entry slip a point when the exit filled better?
Different order types. The entry was a buy stop, which converts to a market order when triggered and takes whatever the book offers — and a continuation entry triggers into a move that is already running, so slipping against you is the normal case rather than bad luck. The exit was a resting limit, which fills at its price or better and never worse. Budget for adverse slippage on entries and treat favorable exit fills as a bonus.
Does the 1:2 taking the lead mean wider targets are better?
No. Its entire $465 lead was built on two consecutive trending sessions, and removing either one puts it behind again. Four days earlier the same table showed the 1:1 ahead by $500 for the mirror-image reason. What the running total currently measures is which kind of day happened most recently.
Why are today’s figures not round numbers?
Because the entry slipped. The buy stop triggered at 29,502.75 and filled at 29,503.75, making the real risk 24.75 points rather than the nominal 25. Every level and every dollar figure is calculated from the actual fill, which is the honest basis even though it produces untidy numbers. A log that rounds entries to the price you wanted is measuring your intentions.
What does VWAP have to do with the test?
Nothing directly, and that distinction matters. VWAP was the reason to believe there was room above the entry — part of the setup read. The 1:1, 1:2 and 1:3 levels are a measurement device imposed by the test design, not targets chosen from the chart. The test compares exit rules on a fixed entry; it is not an evaluation of VWAP as a target.
How reliable are the 1:2 and 1:3 numbers?
Less reliable than the 1:1, which is an actual fill with an actual price. The wider two are read from the price path on a chart, and the difference between a win and a loss in the 1:3 column is often a few points — worth up to $2,970 in that column on a single trade. They are the best available measurement and they are not the same quality of evidence as the live exit. It is the strongest argument for running all thirty trades rather than calling it early.
Related on this site: the 30-day test method · day 5 · day 4 · day 3 · day 2 · day 1
All prices and timestamps are taken from the broker order log for CME_MINI:NQ1! on 22 October 2026; times are US Central. Dollar figures assume one full-size NQ contract at $20 per point. Risk is measured at 24.75 points from the actual fill of 29,503.75 rather than the 29,502.75 stop trigger, so all levels and figures derive from the real entry. Outcomes for the 1:2 and 1:3 targets, , are read from the price path rather than from filled orders. No maximum adverse excursion was recorded for this trade. Every trade in this series uses the same continuation entry on NQ with 100 ticks of nominal risk, one trade a day. Demo account. Seven trades is a log, not evidence. Nothing here is financial advice. Futures trading carries substantial risk of loss.


