Futures: Quietly Green Into the Weekend
US equity index futures are bid across the board in the pre-market, with all three majors pointing higher heading into the open. Polymarket traders are pricing in an opening pop for the S&P 500 as crude oil eases and Iran ceasefire talks continue — which is exactly the same script we've been reading for about three weeks now, just with different actors. Dow futures are hovering around the 50,500 level after Wednesday's 645-point ramp on optimism about the Middle East. The pattern is becoming familiar: ceasefire hope = stocks up, ceasefire wobble = oil up, gold up, everyone confused. For deeper context on how futures positioning shapes the cash open, see our futures coverage. (Benzinga)
Pre-Market Snapshot
| Instrument | Level | Bias | What's Driving It |
|---|---|---|---|
| Dow Futures (YM) | ~50,500 | ▲ Modest gain | Iran de-escalation hopes, oil pullback |
| S&P 500 Futures (ES) | ~7,440 area | ▲ Higher | Recovery from Thursday softness |
| Nasdaq Futures (NQ) | Above 26,300 | ▲ Higher | Digesting NVDA print, Japanese quantum names ripping |
| WTI Crude | ~$97/bbl | ▼ Fading | Off post-conflict highs, but still elevated |
| Brent Crude | ~$105/bbl | — Range | Ceasefire on, ceasefire off, ceasefire on |
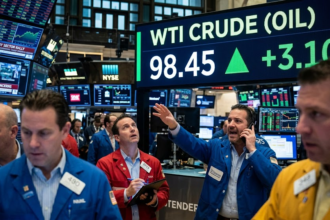
WTI shed 5.66% on Wednesday to close at $98.26 per barrel, while Brent dropped 5.63% to $105.02 after President Trump told reporters the administration was in the "final stages" of negotiations with Iran. The price action is mechanical at this point — every hint of a deal sends crude lower and beta higher. (CNBC)
Equities: NVDA Was "Too Good," Apparently
Nvidia reported fiscal Q1 results after the bell Wednesday, posting EPS of $1.87 on revenue of $81.62 billion — beating the $1.77 and $79.18 billion analysts expected — and guided Q2 revenue to $89.1B–$92.8B versus the Street's $87.3B. The company also boosted its quarterly dividend to $0.25 per share. So naturally, the stock fell 1.77% to close at $219.51 on Thursday, because in 2026 a beat-and-raise from the most important company in the AI universe is now a sell signal. CEO Jensen Huang told the call demand has "gone parabolic" and that "Agentic AI has arrived" — investors said "cool, sell." Data center revenue surged 92% year-over-year to $75 billion with a record $49 billion in free cash flow. The market's response has been to shrug, and that shrug is sending a message. For more on how mega-cap concentration is reshaping the tape, see our day trading coverage. (Yahoo Finance)
Elsewhere in equities, JPMorgan is reportedly seeking to offload risk tied to more than $4 billion in loans to private equity funds — a story to keep an eye on as a credit-stress canary. Japanese quantum computing stocks are ripping in sympathy with US peers. And Meta is being flagged as one of the most volatile names of 2026 after a hot start. (Investing.com)
Crypto: Bitcoin Stuck in the Mud
Bitcoin opened at $77,472.17 on Thursday, up 0.9% from Wednesday's open, before drifting to $77,276 by 7:17 a.m. ET. Ethereum opened at $2,127.36 (up 0.8%) and faded to $2,116.73 over the same window. Both have followed an identical pattern all week: open lower, reverse higher, fade. That's the price action of a market with no conviction either direction. (Yahoo Finance)
The real story on crypto is the ETF flows. US spot Bitcoin ETFs recorded $635 million in net outflows on May 13 — the largest single-day withdrawal since late January — following a worse-than-expected April PPI print that showed inflation rising 1.4% and effectively reset rate-cut expectations. Roughly $77.95 million in BTC long positions got liquidated over 24 hours as the asset rejected its 200-day SMA near $82,270. The key near-term level traders are watching is $80,800 as resistance. For weekly setups across digital assets, our crypto section tracks the structural flows. (Finbold)
Metals: Gold and Silver Can't Catch a Break
Spot gold declined 0.5%–1% in early Friday trade and is struggling to hold above $4,500 per ounce, falling to $4,524.05 on May 22 — down 0.42% on the day and roughly 3.70% over the past month. Despite recent stability, gold prices remain about 14% lower since the Iran conflict began, as markets weigh whether an energy-driven inflation shock will force central banks to tighten. So much for the "wars are bullish for gold" thesis — turns out a wartime gold rally can give it all back when the ceasefire negotiations heat up. (Trading Economics)
The metals weakness Friday was triggered specifically by a directive from Iran's Supreme Leader Ayatollah Mojtaba Khamenei ordering the country's enriched uranium to remain on Iranian soil — contradicting Israeli officials' claims that the uranium would need to be transferred out as part of any peace deal. Cue the gold dump. Silver is faring slightly worse than gold on the day, with MCX silver hitting an intraday low of Rs 2,73,266 per kg before stabilizing around Rs 2,74,175. For traders watching how geopolitics filters into commodities, our futures category has weekly setups. (Goodreturns)
The War: Ceasefire Holds, Barely
Quick recap for anyone just waking up from a coma: Israel and the US launched strikes against Iran on February 28, 2026, aimed at Iran's nuclear and ballistic missile programs and stated goals of regime change. After more than five weeks of fighting that killed thousands and severely disrupted traffic through the Strait of Hormuz — one of the world's most volatile oil chokepoints — the US and Iran agreed on April 7–8 to a Pakistan-mediated ceasefire that has been extended multiple times since. A separate Israel–Lebanon ceasefire took effect April 16. (Britannica)
President Trump told reporters Wednesday that the administration was in the "final stages" of negotiations with Iran. Iran said the latest US proposal "partially bridges the gap" between the countries. That's the good news. The bad news is the Supreme Leader's uranium directive — Tehran wants its enriched uranium to stay home, and Washington's stated objective is for Iran to give up its nuclear program entirely. These two positions are, technically speaking, not the same position. Markets are pricing in deal optimism anyway, because what else are you going to do — sell every rally? (Goodreturns)
High-Impact News This Week
The Fed meeting minutes hit at 2 p.m. ET Wednesday and gave traders plenty to chew on, with Deutsche Bank economists noting that "three FOMC voters objected to the April FOMC meeting statement language implying the next move would be a cut." Translation: the dovish pivot might be less dovish than the tape was hoping. This also marked the first meeting cycle for new Fed Chair Kevin Warsh, whose nomination was approved by the Senate the week before. Welcome to the chair, Kevin — hope you like Middle East oil shocks and a 6.7% inflation expectations print. (Kiplinger)
| Day | Event | Why It Matters |
|---|---|---|
| Mon 5/18 | Chinese Industrial Production, Retail Sales, Unemployment (April) | China demand pulse; Canadian markets closed for Victoria Day |
| Wed 5/20 | FOMC Meeting Minutes (2pm ET) | Three voters objected to dovish language — hawkish risk |
| Wed 5/20 | Nvidia Q1 Earnings (after close) | $81.6B revenue, beat-and-raise — stock fell anyway |
| Thu 5/21 | Walmart, Deere, Ralph Lauren, Ross Stores earnings | Consumer health check across retail tiers |
| Fri 5/22 | Final May UMich Consumer Sentiment | Inflation expectations are the key sub-component |
The final UMich Consumer Sentiment print today is the one to watch. The preliminary reading already showed sentiment near multi-year lows with elevated inflation expectations, and any further deterioration could push the rate-cut probability lower at a moment when the Fed already has internal dissent on a dovish bias. For traders, the 1-year inflation expectations sub-index is more market-moving than the headline number — it's a direct input into how the Fed is currently thinking. (Schwab)
The Bottom Line
Friday's setup is a tug-of-war between four forces: a Nvidia print that confirmed AI demand is "parabolic" but couldn't move the stock, a ceasefire that exists on paper but argues about uranium in practice, ETF flows leaving Bitcoin in a narrow range, and precious metals giving back their war premium. The path of least resistance is a quiet pop into the weekend on Iran de-escalation hopes — but every trader knows the weekend is when headlines tend to break, and "long risk into a Middle East weekend" has been a humbling trade more than once this year. Position accordingly, watch the UMich print at 10am ET, and keep an eye on the $80,800 BTC level if you're playing the digital side. The chop will likely continue until something actually changes — which, ironically, is the most predictable thing in the market right now.