Day 3 of 30: +$500 in 46 Seconds, and the Three Strategies Start to Separate
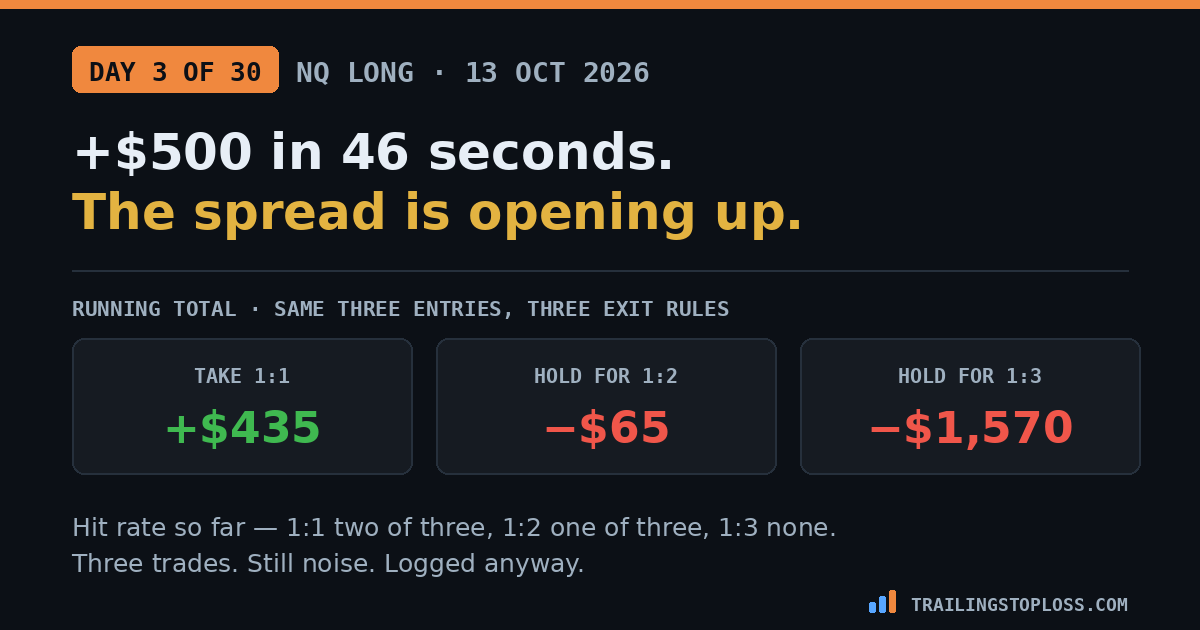
A long on NQ, entered by buy stop at 08:41 and filled 4.50 points above where it was placed. The 1:1 target filled 46 seconds later for $500. Price went on to clear 1:2 before reversing through where the stop sat — so holding for 1:2 would have paid double, and holding for 1:3 would have been a loss. Three trades in, the three exit rules are $2,005 apart.
Running: take 1:1 is +$435. Hold for 1:2 is −$65. Hold for 1:3 is −$1,570.
The trade

Slippage again, on the entry again — 4.50 points this time rather than twelve, and for a long, filling higher is worse. That’s three entries and three slipped fills. It’s becoming the most consistent feature of the data, which is itself worth knowing.

What the wider targets would have done
This is the first day where the three rules produce three genuinely different outcomes.
| Target | Level | Reached? | Result |
|---|---|---|---|
| 1:1 | 30,786.75 | Yes — filled | +$500 |
| 1:2 | 30,811.75 | Yes | +$1,000 |
| 1:3 | 30,836.75 | No — stopped first | −$505 |
So day three is the day that rewards patience — up to a point. The move was worth double at 1:2 and a loss at 1:3, which is exactly the shape the whole test exists to find: there is a distance where holding stops paying, and the question is where it sits.
Three trades, three strategies
| Day | Take 1:1 | Hold 1:2 | Hold 1:3 | What happened |
|---|---|---|---|---|
| 1 — 9 Oct | +$500 | −$500 | −$500 | Reached 1:1, reversed hard |
| 2 — 12 Oct | −$565 | −$565 | −$565 | Stopped first; all levels reached later |
| 3 — 13 Oct | +$500 | +$1,000 | −$505 | Reached 1:2, stopped before 1:3 |
| Running | +$435 | −$65 | −$1,570 | |
| Hit rate | 2 of 3 | 1 of 3 | 0 of 3 |
A $2,005 spread across three trades looks decisive and is not. A strategy with no edge at all shows a profit over thirty trades 43% of the time, and three trades is an order of magnitude below that. If day four reaches 1:3, the 1:3 column gains $1,500 and the ranking shuffles. The table is a log, not a result, and it will keep looking decisive in whichever direction the last trade went.
The pattern I’m watching, and not yet believing
Across three sessions the move has reached 1:1 every time it wasn’t stopped out first, reached 1:2 once, and reached 1:3 never. That is consistent with the no-edge baseline, where a break travels 1R about half the time, 2R 18.5% and 3R 4.9% — three trades is far too few to distinguish the two.
It’s also consistent with my pre-registered prediction that 1:1 wins in this window. Which is precisely why I’m writing it down rather than acting on it: a hypothesis that keeps being confirmed by tiny samples is the most comfortable kind of wrong.
The one thing three days has established properly is the slippage. Twelve points, then 4.50, every entry worse than placed. That wasn’t in the original spec and it’s now a logged column — on a 25-point stop, a few points of entry slippage is a meaningful share of the edge before the trade starts.
The honest limits
The 1:2 and 1:3 outcomes are reconstructions. They assume the position survives to the levels shown with the stop where it sat, which the price path supports but no filled order confirms.
Three trades is not a sample. Nothing in the running total should change anyone’s trading, including mine. The rules stay as written for all thirty.
And this is a demo account, where fills are usually optimistic. Three slipped entries on a demo is a point worth carrying into any live version of this.
The short version
Day three: long NQ, buy stop placed at 30,757.25 and filled at 30,761.75 — 4.50 points of slippage, the third slipped entry in three trades. The 1:1 target at 30,786.75 filled 46 seconds later for +25 points and $500. Price continued through 1:2 at 30,811.75 before reversing past the stop, so holding for 1:2 would have returned $1,000 and holding for 1:3 would have lost $505. Running totals across the same three entries: take 1:1 is +$435, hold for 1:2 is −$65, hold for 1:3 is −$1,570, with hit rates of 2, 1 and 0 out of 3. The spread looks decisive and isn’t — three trades is far below the sample needed to separate any of this from noise, and a single day reaching 1:3 would reorder the table.
Frequently asked questions
What happened on day 3 of the test?
A long on NQ entered by buy stop placed at 30,757.25 and filled at 30,761.75, 4.50 points worse. The 1:1 target at 30,786.75 filled 46 seconds later for 25 points, or $500 on one contract. Price then cleared the 1:2 level at 30,811.75 before reversing through the stop, meaning a 1:2 target would have returned $1,000 while a 1:3 target would have been stopped out for $505.
Which risk-to-reward ratio is winning after three trades?
Taking 1:1 is ahead at +$435, against −$65 for holding to 1:2 and −$1,570 for holding to 1:3, with hit rates of 2, 1 and 0 out of 3. That spread is not meaningful at this sample size — a strategy with no edge shows a profit over thirty trades about 43% of the time, so three trades cannot separate skill from variance. One day reaching 1:3 would add $1,500 to the bottom column and change the ranking.
Why does every entry keep slipping?
All three entries have been stop orders, and a stop becomes a market order the moment it triggers — it fills where price is rather than at the level typed. The slips so far are twelve points, then 4.50, always against the position: a short filled lower and a long filled higher are both worse entries. On a 25-point stop that is a meaningful share of the edge surrendered before the trade starts, which is why slippage is now logged as its own column.
Does a wider target ever win in this test?
Day three is the first time it would have. The move cleared 1:2 for a $1,000 result against $500 at 1:1, then reversed before 1:3 for a $505 loss. That is the shape the experiment is designed to locate — there is a distance at which holding stops paying, and the whole point of running thirty trades is to find roughly where it sits rather than guessing from one good day.
Related on this site: the 30-day test method · day 2 · day 1 · the no-edge baseline
All prices and timestamps are from the broker order log for CME_MINI:NQ1! on 13 October 2026; times are US Central. Dollar figures assume one full-size NQ contract at $20 per point. Outcomes for the 1:2 and 1:3 targets are reconstructed from the subsequent price path rather than filled orders. Demo account. Three trades is a log, not evidence. Nothing here is financial advice. Futures trading carries substantial risk of loss.