Day 7 of 30: +$525, and the Narrow Target Is Now Last
A second consecutive long. Buy stop filled at 29,231.75, target filled at 29,258.00 thirty-five seconds later for $525, and price carried through every level with room. It is the third straight day the 1:3 would have paid, and the ranking that looked settled two weeks ago has completely reversed.
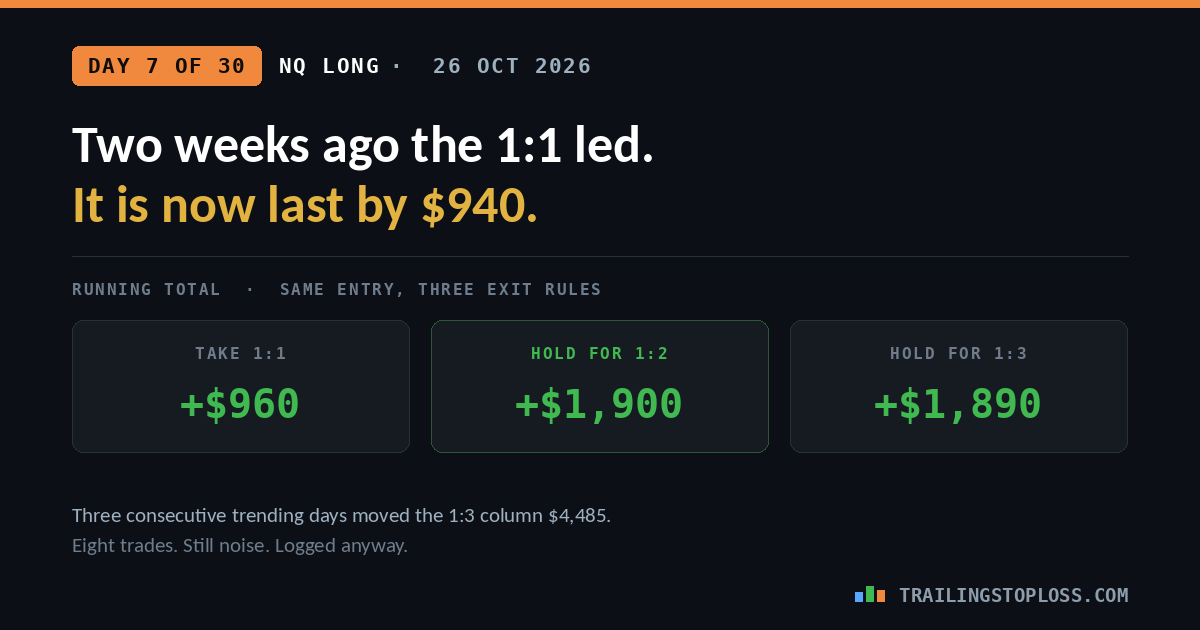
On 13 October the 1:1 led the 1:3 by $2,005. Today it trails the 1:2 by $940. Nothing about the strategies changed in between.
The trade


The two slips cancelled exactly. The buy stop triggered at 29,230.75 and filled a point worse at 29,231.75; the resting limit at 29,257.00 filled a point better at 29,258.00. Net cost for the day, zero. That is the first time in this series the entry and exit slippage have offset to the tick, and it is a coincidence rather than a pattern — the two order types have different and opposite biases, so they tend toward a small net cost rather than toward zero.
All three levels, again
Risk was a clean 25.00 points from the fill, putting the levels at 29,256.75, 29,281.75 and 29,306.75. Reading the chart’s own level lines and calibrating against the known entry and stop prices, the session high sits roughly twenty points above the 1:3. This one is not close.
| Target | Level | Reached? | Result |
|---|---|---|---|
| 1:1 | 29,256.75 | Yes — filled at 29,258.00 | +$525 |
| 1:2 | 29,281.75 | Yes | +$1,000 |
| 1:3 | 29,306.75 | Yes, clearly | +$1,500 |
The ranking has inverted
| Day | Take 1:1 | Hold 1:2 | Hold 1:3 | What happened |
|---|---|---|---|---|
| 1 — 9 Oct | +$500 | −$500 | −$500 | Reached 1:1, reversed hard |
| 2 — 12 Oct | −$565 | −$565 | −$565 | Stopped first; all levels reached later |
| 3 — 13 Oct | +$500 | +$1,000 | −$505 | Reached 1:2, stopped before 1:3 |
| 4 — 14 Oct | −$1,025 | −$1,025 | −$1,025 | Two trades, both stopped before 1:1 |
| 5 — 20 Oct | +$510 | +$1,000 | +$1,500 | Cleared all three targets |
| 6 — 22 Oct | +$515 | +$990 | +$1,485 | Cleared all three targets |
| 7 — 26 Oct | +$525 | +$1,000 | +$1,500 | Cleared all three targets |
| Running | +$960 | +$1,900 | +$1,890 | — |
| Hit rate | 5 of 8 | 4 of 8 | 3 of 8 | — |
Two weeks ago the table said something clear and apparently sensible: take the 1:1, it is $500 clear of the 1:2 and $2,005 clear of the 1:3, and the widest target is a trap. Today the same table, built the same way from the same entries, says take the 1:2 or the 1:3 and avoid the narrow one.
Nothing about the three strategies. They are arithmetic applied to the same entries; they have no state and no memory. What changed is that three consecutive sessions trended cleanly, and a trending session rewards width.
The 1:3 column has moved +$4,485 in three trading days — from −$2,595 after day 4 to +$1,890 now. Any column capable of a four-and-a-half-thousand-dollar move in three sessions is equally capable of giving it back in three, and days 2 and 4 are what it looked like going the other way.
This is the whole argument for a fixed sample size decided in advance. Had I stopped on 13 October, the conclusion would have been “narrow targets win.” Had I stopped today, it would be “wide targets win.” Both would have been written with equal confidence and both would have been noise. The thirty-trade commitment exists precisely so that whichever story the data is telling on a given Tuesday does not get to be the answer.
The 1:2 and 1:3 have converged to ten dollars
Worth noting separately: the two wide columns are now $1,900 and $1,890 — ten dollars apart after eight trades. They are tracking each other closely because on the three recent trending days both reached their target, and on the stopped days both lost identically. The only trade that has ever separated them was day 3, which reached 1:2 and stopped before 1:3.
That is the real question the remaining twenty-three trades have to answer, and it is narrower than the one the test started with. The gap between taking a 1:1 and holding wider is already large and may well be real. The gap between 1:2 and 1:3 is ten dollars, and separating those two will need many more days of the day-3 variety — trades that go far enough to pay one and not the other.
Still no MAE column
Day 4 committed to logging maximum adverse excursion from day 5. It is day 7 and it is still not there. Today the trade was in profit almost immediately and the stop was never approached, which again makes the honest entry “probably close to zero” and again makes it useless.
Three missing entries out of eight is no longer a rounding error. If the remaining twenty-three trades carry it and these do not, the stop-width question gets answered on twenty-three observations rather than thirty, which is survivable. If the habit does not form, it does not get answered at all.
The honest limits
- Eight trades. Five winners, three of them consecutive and all three in the same market condition. That is not a sample, it is a streak.
- The last three days are highly correlated. They are not three independent observations of the strategy; they are three draws from the same trending regime. The effective sample size is smaller than the trade count suggests.
- The 1:2 and 1:3 outcomes are chart reads, not fills. The 1:1 is an actual order with an actual price; the other two are inferences from where price went.
- No MAE recorded, for the third consecutive trade.
- Range width is not recorded either, which the continuation piece argued is the variable most likely to separate the winners from the losers in this series. Both gaps are in the method, not the market.
- Demo account, one full-size NQ contract, $500 of risk per trade — still a size no prop account in this test’s price range could survive.
The short version
- Second straight long. Buy stop filled at 29,231.75, target filled at 29,258.00, +26.25 points, +$525, held 35 seconds.
- Entry slipped a point against, exit slipped a point in favor. Net slippage zero, for the first time in the series.
- All three levels cleared with room. Third consecutive day the 1:3 would have paid.
- Running: 1:1 +$960, 1:2 +$1,900, 1:3 +$1,890.
- The 1:1 led the 1:3 by $2,005 on 13 October. It now trails the 1:2 by $940. The strategies did not change; the market did.
- The 1:3 column has swung $4,485 in three sessions. It can swing back just as fast.
- 1:2 and 1:3 are ten dollars apart. Separating those two is the question the rest of the test actually has to answer.
- MAE still not logged, three trades running.
Frequently asked questions
Does three straight wins mean the wide targets are better?
No, and the same logic applied two weeks ago would have proved the opposite. The three recent sessions trended cleanly, which is the market condition that rewards width; days 2 and 4 did not, which is why the wide columns were thousands of dollars behind at that point. The running total is currently reporting what kind of week it has been.
Why keep taking the 1:1 live if it is the worst performer?
Because changing the live exit rule mid-test on eight trades would destroy the thing being measured, and because the 1:1 was the best performer a fortnight ago on exactly the same quality of evidence. The design takes one rule live and reconstructs the other two throughout, so that the comparison at trade thirty is between three rules applied consistently rather than three rules chased in sequence.
What would make the 1:2 versus 1:3 question answerable?
Trades of the day-3 kind — ones that travel far enough to pay the 1:2 and then reverse before the 1:3. Those are the only trades that separate the two columns, since on any day that clears all three, or on any day that stops out first, both record the same result. Eight trades have produced exactly one of them.
Is a 35-second trade really a strategy or just luck?
Short holding times are what a continuation entry looks like when it is taken outside the rotation: the move is already running, so the trade either resolves quickly or the premise was wrong. Days 5, 6 and 7 resolved in 23, 49 and 35 seconds. Whether that reflects an edge or a trending fortnight is precisely what thirty trades are for.
Why does the entry keep slipping against you?
Because it is a stop order entering a move that is already moving. When the stop triggers it becomes a market order and takes what the book offers, which in a fast move is a tick or four worse than the trigger. It is the structural cost of continuation entries rather than bad execution, and the right response is to budget for it rather than to treat each instance as an injustice.
Related on this site: the 30-day test method · how continuation entries work · day 6 · day 5 · day 4 · day 3
All prices and timestamps are taken from the broker order log for CME_MINI:NQ1! on 26 October 2026; times are US Central. Dollar figures assume one full-size NQ contract at $20 per point. Risk is 25.00 points measured from the actual fill of 29,231.75 rather than the 29,230.75 stop trigger. Outcomes for the 1:2 and 1:3 targets are read from the price path rather than from filled orders; the session high was estimated by calibrating the chart’s own level lines against the known entry and stop prices. No maximum adverse excursion was recorded for this trade, the third consecutive omission. Every trade in this series uses the same continuation entry on NQ with 100 ticks of nominal risk, one trade a day. Demo account. Eight trades, three of them consecutive draws from the same trending conditions, is a log rather than evidence. Nothing here is financial advice. Futures trading carries substantial risk of loss.


