There's a moment in every trader's career when you realize the math doesn't care about your conviction. Position sizing, expectancy, drawdown — these are the boring numbers separating funded traders from people who pay for evaluations once a month and then complain about prop firms on Reddit. We've spent the better part of a year building a free toolkit to make that math un-ignorable. Here's the full lineup, grouped by what they actually do for you.
The Four Categories Every Trader Needs
Active traders use tools across four broad categories — and most people are dangerously over-invested in one while neglecting the other three. The trader who lives on TradingView indicators but has never calculated their actual expectancy is the same trader who'll spend $500 in evaluation fees before figuring out their setup has a negative edge. Position sizing, edge measurement, prop firm planning, and market context all matter, and the brutal truth from the data is that most failures come from rule breaches and risk control problems rather than bad strategies.
Category 1: Risk & Position Sizing
If you only use tools from one category, make it this one. Position sizing is the single most controllable variable in trading outcomes, and a 2024 Finance Magnates poll cited by industry researchers found that most prop traders spend four figures on challenge fees before seeing a payout — if they ever do. Almost all of that is preventable with correct sizing math before each trade.
Position Size Calculator
The most-used tool on the site, and the one that should be open in a tab any time you're about to click buy. Input your account balance, max risk per trade as a percent or dollar amount, and your stop distance. Out comes the exact contract or share count that keeps you inside your risk budget. Built specifically with prop firm drawdown limits in mind, so it doesn't pretend you have access to your full account equity when you're actually trading against a $2,000 daily loss window.
Stop Loss Calculator & R:R Visualizer
Position sizing's twin. Plan the trade visually with a price ladder showing your 1R through 5R targets, exact position size for futures, forex (micro/mini/standard lots), crypto, and stocks. The break-even win rate calculation at the bottom is the part most traders skip and then later complain about — a 1:1 R:R setup needs to win more than half the time after commissions, and the calculator will tell you exactly how much more.
Pip & Tick Value Calculator
Forex traders running anything other than a USD-denominated account already know why this exists. Pip value changes based on the quote currency, the cross rate to your account currency, and the lot size, and getting it wrong by 8% on every trade compounds into real money. Live FX conversion handles the cross-rate math automatically, covers majors, minors, exotics, gold, silver, and the major cryptos. JPY pip sizing baked in correctly — because 0.01 is not 0.0001, no matter how many tutorials tell you "a pip is the fourth decimal."
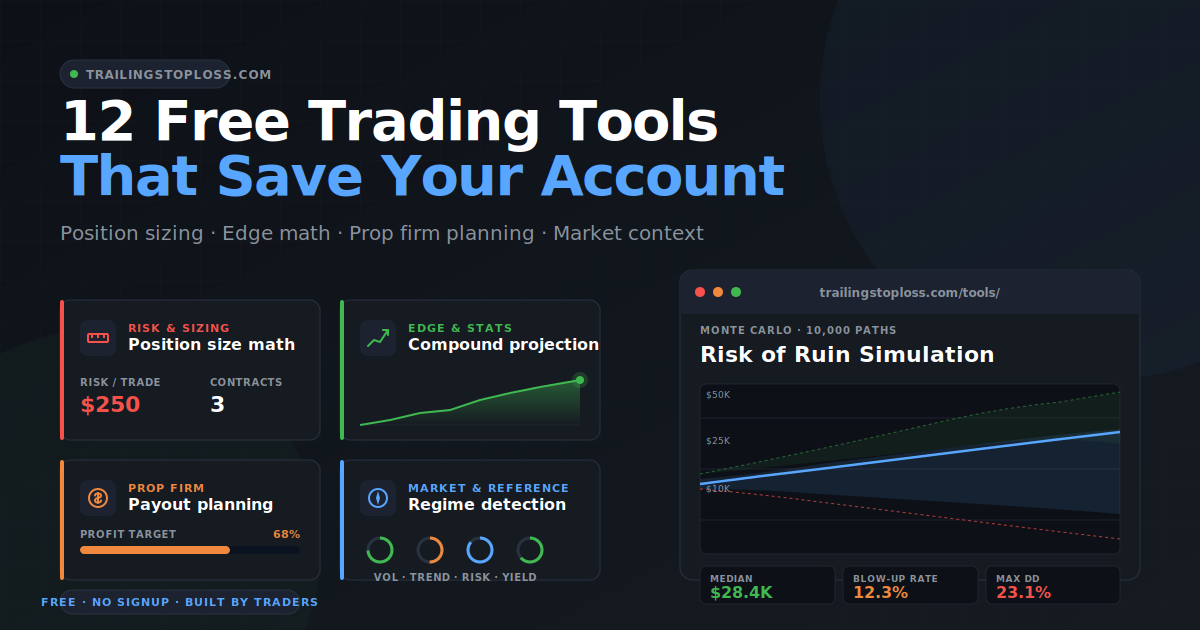
Risk of Ruin Calculator
A Monte Carlo simulator that runs 10,000 trade sequences against your strategy to show the actual probability of your account hitting zero. Includes presets for Apex, Topstep, FTMO, and MyFundedFutures, so you can model real prop firm drawdown rules instead of the simplified "lose everything" version. The output is occasionally horrifying. That's the point. People who size their risk based on vibes tend to find out things are worse than they thought.
Category 2: Edge & Performance
Risk management keeps you in the game; edge measurement tells you whether the game is worth playing in the first place. The brutal reality is that strategies that "feel" profitable often aren't once you account for commissions, slippage, and the fact that your win rate during a strong trend regime isn't your win rate during chop. The tools in this category force you to look at the actual numbers, which is uncomfortable but cheaper than another evaluation reset fee.
Win Rate Calculator
Enter your wins, losses, and breakeven trades to get your actual win rate alongside expectancy, profit factor, and the break-even win rate required at your current reward-to-risk ratio. The last number is the one people don't want to see — if you're trading 1:1 R:R and winning 49% of the time after costs, you're a slow-bleed donor to the broker, not a trader. The calculator makes that visible in about three clicks.
Compound & Account Growth Projector
Project realistic account growth per trade, per day, or per month with Monte Carlo drawdown simulation built in. Most "compound interest calculators" floating around show you the fairy-tale version — assume 2% per day, compound for a year, retire to Bali. This one overlays 5,000 simulated paths against your deterministic projection so you can see the realistic distribution of outcomes. Compare up to three scenarios side-by-side and flip on prop firm mode to see what percentage of those simulated paths blow the account before payout. Spoiler: it's higher than you want it to be.
P&L Calendar & Trading Journal
The journal that doesn't try to upsell you to a $40/month subscription. Daily P&L calendar with built-in drawdown tracking for the major prop firms, R-multiple logging, setup tags, and an emotional state field that, if you actually fill it in honestly, will reveal patterns about your trading you'd rather not know. Installable as a PWA so it lives on your phone home screen like a real app. The most underrated tool in the toolkit because journaling is unglamorous and that's exactly why it works.
Category 3: Prop Firm Planning
Independent research and self-reported firm data consistently put prop firm challenge pass rates between 5% and 10%, with only around 7% of all evaluation participants ever receiving a payout. The math is hostile. Going in blind makes it worse. These tools exist to make sure you understand the rules of the game before you fund the challenge.
Prop Firm Payout Calculator
Maps your path from evaluation purchase to first withdrawal across 11 major firms including Apex, Topstep, MFFU, Tradeify, Bulenox, TickTickTrader, FTMO, FundedNext, The5ers, Funding Pips, and FX2. Tracks profit targets, drawdown buffer, qualifying days, consistency rule violations, and projects a realistic timeline. The estimated-days output is usually three times what new traders assume, which is the entire reason most quit before getting paid.
Prop Firm Comparison
Side-by-side breakdown of evaluation cost, profit split, drawdown rules (trailing versus static — they are not the same), and payout terms across the major futures prop firms. The tool that exists because firm marketing pages all look identical and the differences only show up after you've already paid. Use this before the credit card, not after the email "your account has been breached."
Category 4: Market State & Reference
Context tools. The ones you check before the open and reference during the session. Most traders get into trouble when their setup is fundamentally incompatible with the current regime — running a mean-reversion strategy in a strong trending market, scalping volatility expansion when the VIX is dead, that kind of thing. The reference tools handle the boring lookup work so you spend zero time hunting for contract specs at 8:55 a.m.
Market Regime Detector
Real-time five-axis classification of market conditions — volatility, trend, risk sentiment, correlation, and yield curve. Tagged with the actual backtest edge of various strategy archetypes across 14 years of SPY data, so you can see whether the current regime has historically been kind to breakouts, mean reversion, or neither. The closest thing to a "what should I be doing today" indicator that doesn't lie to you.
Futures Tick Value Reference
Search 45+ futures contracts by tick value, point value, exchange, day-trade margin, and trading hours. Includes a built-in position risk calculator so you can confirm sizing without leaving the page. The reference table you wish your broker provided but they bury in a PDF behind three menus.
Futures Expiration Calendar
Rollover dates, last trading days, and contract month codes for every major futures contract. Bookmark this one and never get caught holding a position into expiration again. The kind of tool that prevents stupid mistakes you'd be embarrassed to explain on Twitter.
Which Tools Should You Actually Use?
Different traders have wildly different priorities, and pretending otherwise is how generic "top 10 trading tools" articles end up useless. Here's the realistic priority order based on where you are in the journey.
| Trader Stage | Priority Tools | Why |
|---|---|---|
| New retail trader | Position Size, Stop Loss, Win Rate | Master sizing first. Edge measurement comes second. Everything else is noise. |
| Pre-evaluation | Risk of Ruin, Compound Projector, Prop Firm Comparison | Stress-test the strategy against drawdown rules before paying the challenge fee. |
| In evaluation | Payout Calculator, P&L Journal, Position Size | Daily discipline. Track drawdown buffer constantly. Don't oversize. |
| Funded | P&L Journal, Regime Detector, Compound Projector | Protect the account. Match strategy to regime. Project realistic payout timelines. |
| Active forex trader | Pip Value Calc, Position Size, Win Rate | Cross-currency conversion matters more than you think. |
| Active futures trader | Tick Value Reference, Expiration Calendar, Position Size | Reference work plus sizing math — the bread and butter. |
What's Missing (And What's Coming Next)
This is the part where most "free tools" sites pretend they've solved trading. Trading isn't solved. The toolkit covers risk, edge, prop firm planning, and basic market context, but there are real gaps — an economic calendar filtered by your instrument, a correlation matrix for futures and forex, time-of-day performance analytics, a session-overlap clock for the forex crowd. These are on the list. Some will get built. Tools that actually solve problems for the community get priority over tools that look impressive in a screenshot.
If there's a calculation you're doing manually every day that should be a tool, drop a note via the contact page. The best ideas come from traders who've identified the friction.
Frequently Asked Questions
Are these trading tools really free?
Yes. Every tool runs in your browser, no signup, no email capture, no premium tier. The site is supported by a few transparent affiliate links elsewhere in the content, not by paywalling the tools themselves. Bookmark what you use and ignore the rest.
Which trading tool should I use first if I'm new?
The Position Size Calculator. It's the highest-impact tool in the toolkit because correct sizing eliminates the single biggest cause of blown accounts — risking too much per trade relative to drawdown limits. Once sizing is locked in, the Win Rate Calculator and Stop Loss Calculator come next. Edge measurement and prop firm tools become relevant after sizing discipline is established.
Do the prop firm tools work for forex prop firms or only futures?
Both. The Prop Firm Payout Calculator and Compound Growth Projector cover 11 firms across futures and forex — Apex, Topstep, MFFU, Tradeify, Bulenox, TickTickTrader, FTMO, FundedNext, The5ers, Funding Pips, and FX2. Each firm's actual drawdown rules (trailing vs. static, daily loss limits, consistency thresholds) are modeled in the calculations rather than using a generic stand-in.
How accurate is the Risk of Ruin Calculator?
The Monte Carlo simulation runs 10,000 trade sequences against the win rate, reward-to-risk, and risk-per-trade values you input. That's a statistically robust sample for the inputs given. The limitation is that real markets exhibit fat tails — losing streaks longer than a normal distribution would predict — so consider the output a realistic floor rather than a worst case. If the calculator says you have a 15% ruin probability, treat your true probability as 20%+.
Why are prop firm pass rates so low?
Industry data consistently shows pass rates between 5% and 10%, with most failures happening in the first week of trading and driven by drawdown breaches rather than missed profit targets. The structural issue is that traders treat the account size as their risk capital when the real risk window is the much smaller drawdown buffer. A $50,000 account with a $2,500 trailing drawdown is functionally a $2,500 account, and sizing for the headline number rather than the actual loss limit is the most common failure mode.
Do you have a mobile app?
The P&L Calendar & Trading Journal is installable as a Progressive Web App, which means it can be added to your phone's home screen and used like a native app. The other tools are mobile-responsive and work in any browser. There's no separate app store download because there doesn't need to be — modern web tools work everywhere.


