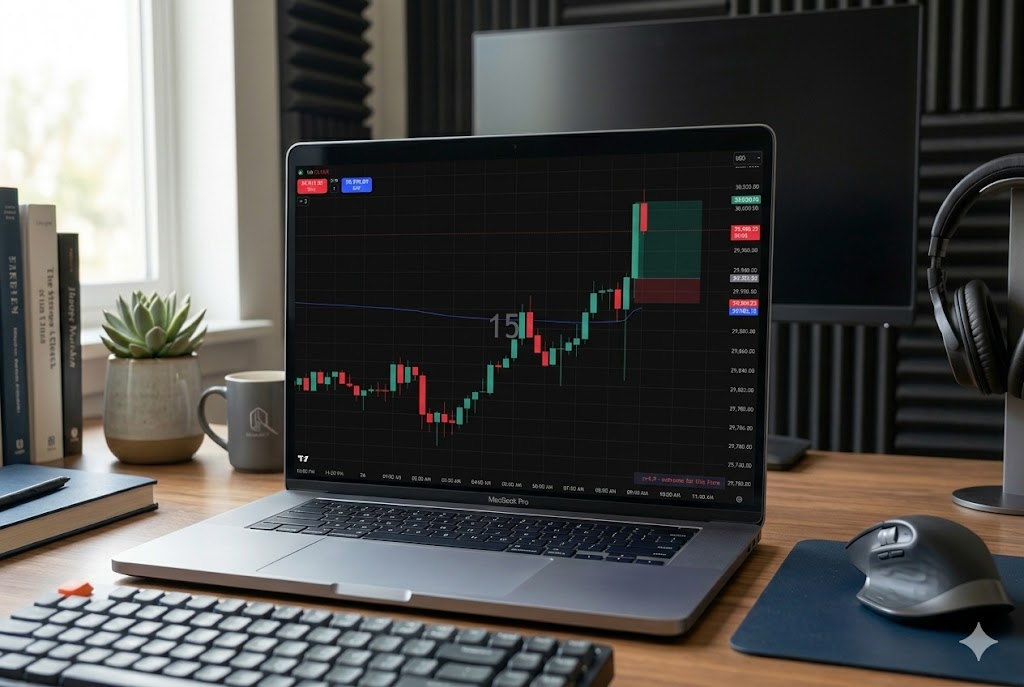
Volume z-score is one of those concepts that's mathematically simple but maddeningly hard to find in a usable TradingView indicator. The premise: how unusual is the current bar's volume, expressed as a standard-deviation count against a meaningful baseline? Most "z-score volume" scripts on TradingView solve this by computing z against a rolling 50-bar window, which sounds reasonable until you realize a rolling window doesn't know that 9:30 AM is always busier than noon. A 3× spike against the last 50 bars is meaningless if those 50 bars span the lunch lull. A 0.5× reading at the open isn't quiet — that's just the open.
Volume Z-Score Readout solves this by comparing the current bar's volume against the same time of day across the trailing 21 sessions (default). The "9:45 AM bar" gets compared to all the other 9:45 AM bars from the past month. A z-score of -3.0 at noon is genuinely meaningful — it's saying the market is unusually quiet for noon, not just quiet relative to a random rolling window. The output is one small box on the chart, in plain English: z=-3.0 · unusually quiet.
The indicator is built around three trader-friendly presets that turn the technical settings into plain-English choices. Pick "Swing trader" for the baseline length, "Auto-detect (24h)" for the market type, "Balanced" for the alert sensitivity — those are the defaults — and you're done. No timeframe lookup tables, no σ-band guessing.
Try it free
Volume Z-Score Readout is published as open-source Pine Script v6 on TradingView. Free forever, no signup, no paid tier. Source code visible on the script page.
View on TradingView →What you see on the chart
One small overlay box, sitting in a corner of your choice. The text and color shift through four bands based on how unusual the current bar is:
The verdict is direction-aware. Positive z-scores read "busier"; negative read "quieter." A z of -2.1 isn't ambiguous — it specifically means the current bar is unusually quiet for this minute of the day. That distinction matters because volume silence is often as meaningful as a spike: distribution days often start with eerily-quiet bars; major reversals frequently begin with conviction drying up rather than aggressive selling.
How the math works
The calculation is intentionally simple. For each bar, the script collects the volume at the same time-of-day from the trailing N sessions (where N is set by your Trader style preset), then computes:
z = (current_volume − mean) / standard_deviation
That's it. A z of 0 means perfectly average for this minute. A z of +1 means one standard deviation above. A z of +3 means three standard deviations above — extreme by any reasonable statistical measure (roughly the 99.7th percentile in a normal distribution).
The reason this is more useful than a rolling-window z-score: intraday volume isn't normally distributed when measured against a rolling window. It's heteroscedastic — the variance changes systematically throughout the session. The opening 30 minutes have huge variance; the lunch lull has tiny variance. A z computed against rolling history blends those incompatible distributions and produces noise. Comparing 9:45 AM bars to other 9:45 AM bars keeps the math clean.
The three presets that handle most setup
Rather than make you pick numeric thresholds and consult a bars-per-session lookup table, the indicator exposes three preset dropdowns that translate the math into plain-English choices. The defaults work out of the box for a 15m NQ chart — most users won't change anything.
1. Trader style — controls baseline responsiveness
How many past sessions feed the time-of-day mean and standard deviation.
2. Market preset — auto-computes bars-per-session
Picks the right "bars per session" stride for the math based on your market type and current chart timeframe. No more manual lookup tables.
3. Sensitivity — controls how often the alert fires
Sets the |z| threshold that triggers the "Unusual volume" alert. Doesn't affect the readout display itself — only the alert.
About the "Custom" escape hatches: Pine Script can't truly hide inputs based on other input values. So the "Sessions to average," "Bars per session," and "Alert threshold" numeric inputs always appear in the settings panel — they just have "(only if Custom)" appended to their labels. The script ignores them unless the related preset is set to Custom. Leave them alone for the default case.
Default behavior: 15m NQ with zero configuration
Drop the indicator on a 15m NQ chart with the default settings and it works immediately. Here's what the defaults give you:
| Setting | Default | Effect |
|---|---|---|
| Trader style | Swing trader | 21-session baseline (~one month) |
| Market preset | Auto-detect (24h) | Auto-computes 96 bars/session at 15m |
| Sensitivity | Balanced | Alert fires at |z| ≥ 2.0 |
| Readout position | Top right | Sits above price action in the corner |
| Text size | Normal | Readable without zoom |
| Show label cell | Off | Compact single pill, no "Time-of-day" prefix |
The auto-detect 24h preset is slightly conservative for NQ (the real futures session is ~23h, not 24h), but the difference is only one bar per session — close enough that the math works fine. If you want it perfect, switch to the "Futures (~23h)" preset; the change is small but exact.
The four sigma bands explained
The verdict text and color map directly to standard-deviation thresholds. Understanding these helps calibrate your expectations for how often each band should fire.
| Band | Color | Verdict (positive z) | Verdict (negative z) | Approx. frequency |
|---|---|---|---|---|
| |z| < 1 | Grey | Normal for this time | Normal for this time | ~68% of bars |
| 1 ≤ |z| < 2 | Blue | Busier than usual | Quieter than usual | ~27% of bars |
| 2 ≤ |z| < 3 | Orange | Unusual for this time | Unusually quiet | ~4% of bars |
| |z| ≥ 3 | Red | Extreme for this time | Extreme silence | <1% of bars |
The frequencies above assume a normal distribution, which volume only approximately follows. In practice, intraday volume has a fat right tail (more extreme positive z-scores than a normal distribution would predict) and a compressed left tail (fewer extreme negatives because volume can't go below zero). Red-band readings will appear slightly more often than the 1% theoretical baseline, especially around the open and on news bars.
Above 1h timeframes, the readout becomes unreliable. A 4h chart only contains ~6 four-hour bars per futures session, which means the time-of-day mean and SD are averaging six samples — too coarse to be statistically meaningful. The indicator will still render at 4h+ but treat the verdict skeptically. This is fundamentally a 1m-to-1h tool.
Why overlay instead of its own pane
This indicator overlays on the price chart by design. Most users running a z-score readout are already running a separate volume display — TradingView's native volume bars, Session Volume Pulse, a Volume Profile, or similar. Adding another full pane just for a single status box would waste vertical chart space.
The overlay sits in a corner of the price chart, leaving the volume pane untouched for whatever's already there. Pick top-right (the default), top-left, or one of the seven other position options depending on where your price action lives.
Companion to Session Volume Pulse
This indicator shares its mathematical foundation with Session Volume Pulse, which includes a built-in z-score toggle (off by default). If you want the full volume kit — bars colored by spike state, time-of-day baseline line, spike multiplier labels, AND the z-score readout — install Session Volume Pulse instead. This standalone is for users who already have a volume display they're happy with.
One important difference if you run both: Session Volume Pulse defaults to 14 sessions for its baseline (tuned for spike-detection responsiveness). This standalone defaults to "Swing trader" = 21 sessions (tuned for statistical stability of band crossings). Both choices are intentional — but if you run both indicators on the same chart and notice the SVP baseline curving differently than the z-score readout suggests, that's why. To match them: set SVP's "Baseline sessions to average" to 21, or set this standalone's Trader style to Custom with 14 sessions.
How to install
- Open the script page on TradingView.
- Click the star icon to add to your favorite indicators.
- Open any chart. Click Indicators in the top toolbar.
- Click Favorites. Click "Volume Z-Score Readout [TSL]" to load it.
- For default 15m futures use: no configuration needed. For other markets or styles, click the gear icon and pick the appropriate presets.
Honest limitations
It doesn't predict price direction. A z=+3.0 with a green candle close is bullish confirmation; the same z=+3.0 with a red close is often capitulation or distribution. The indicator surfaces statistical extremes; reading what that means for direction is on you.
It doesn't work on symbols without real volume. Most spot forex pairs on retail platforms report tick count, not actual volume. The indicator will produce numbers but they're measuring tick activity, not capital flow. For genuine forex volume analysis, switch to the equivalent futures contract (6E, 6J, 6B) and you'll get real volume data. More context on forex volume issues in our forex prop firm content.
It needs history. On a freshly-listed symbol with fewer than N sessions of historical data (where N is set by your Trader style preset), the SD calculation may be unstable for the first few sessions. The verdict will read "insufficient history" until enough samples accumulate.
DST and holiday-shortened sessions distort the baseline. When the DST transition happens or you have a half-day Friday in your lookback window, the time-of-day stride gets offset by a bar or two. The math self-corrects within a few weeks as those abnormal sessions roll out of the lookback window, but expect minor wonkiness around those transitions.
Frequently asked questions
Why a z-score instead of just a volume multiplier?
A multiplier (like "current volume is 2.5× the recent average") is threshold-aware in one direction only — it tells you the bar is bigger than average, but not by how many standard deviations. A z-score is threshold-aware in standard-deviation units, which means the same threshold (say, z=2) means the same statistical thing across every market and every timeframe. You don't have to retune the threshold per instrument. A 2.5× multiplier on NQ at the open is unremarkable; a 2.5× multiplier at noon is huge. The z-score handles this automatically because the SD scales with the time-of-day variance.
Why does the Trader style preset default to 21 sessions instead of 14 or 50?
21 is roughly one calendar month of trading (5 days × 4.2 weeks ≈ 21). That's enough samples to compute a stable mean and SD without being so long that volume regime changes get smeared. Below 14 sessions the SD is too noisy; above 50 sessions the math is too slow to adapt to vol regime shifts (FOMC cycles, earnings seasons). 21 is the local optimum for 15m futures based on testing across NQ, ES, and CL over the past three quarters. If your style needs different responsiveness, use the Day trader (14 sessions) or Position trader (42 sessions) presets — or pick Custom and set your own.
What's the difference between Auto-detect and Futures market presets?
Auto-detect assumes a 24-hour trading session, which is correct for crypto and approximately correct for futures. Futures presets assume ~23 hours, accounting for the daily 1-hour close. The difference works out to one bar per session at most timeframes — usually too small to matter visibly. Use Futures for slight accuracy improvement if you trade NQ/ES/CL/GC. Use Auto-detect for everything else. Use US stocks RTH for any symbol trading regular-hours-only.
Will this indicator give me a trading edge?
No indicator gives anyone an edge by itself. Tools surface information; edges come from a tested strategy, disciplined risk management, and consistent execution. The z-score readout exists to make a specific information faster to read — "is this volume statistically unusual for this minute?" is faster to answer with a labeled pill than by squinting at a raw volume pane. That's a workflow improvement, not a strategy.
Can I use it on lower timeframes than 15m?
Yes, down to 1m. The Market preset handles the math automatically — pick the right preset (Auto-detect for crypto, Futures for futures, US stocks RTH for equities) and the indicator computes the correct bars-per-session for whatever timeframe you're on. On 1m you'll see far more "normal" (grey) readings because every individual minute carries less information; the band-crossing events are still meaningful when they happen.
Why does the verdict say "extreme silence" instead of just "extreme"?
Direction matters. A z=+3.5 means today's bar is dramatically busier than this minute usually is; a z=-3.5 means it's dramatically quieter. Just saying "extreme" would be ambiguous. The asymmetric phrasing ("extreme for this time" for positive, "extreme silence" for negative) makes the direction obvious at a glance. Some trading setups specifically care about silence — distribution before reversals, low-volume bull traps, drying-up demand — so the negative side of the distribution deserves its own clear language.
Is this affiliated with TradingView, a prop firm, or any broker?
No. This is an independent open-source project published on TradingView's public script library. No commercial relationship with TradingView, with any prop firm referenced in our prop firm directories, or with any broker. Partnership disclosures, if any are made in the future, will appear on this page and on the script's TradingView listing.
Install Volume Z-Score Readout
Open source, free forever, Pine Script v6. Sits as an overlay on any TradingView chart. Three presets, zero math required for default use.
View on TradingView →Published by NicksNotNaked. Source code visible on the TradingView script page.