Strait of Hormuz Closed, Oil at $108, S&P 500 at Record Highs: How Are Markets Still Climbing?
Oil tankers are stranded, gas is over $6 a gallon in California, and Wall Street's response has been to throw a parade. Here's the actual math behind the most counterintuitive rally of the decade.
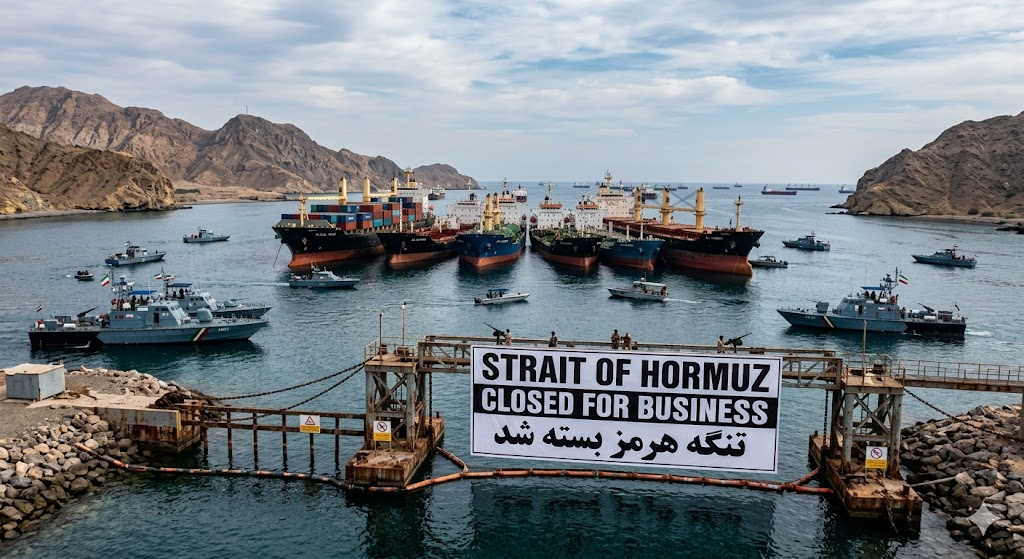
Quick recap for anyone who's been hiding in a bunker since February: the U.S. and Israel launched Operation Epic Fury against Iran on February 28, the Supreme Leader is dead, Iran shut the Strait of Hormuz on March 4, Brent hit $138 a barrel on April 7, and roughly 20% of the world's seaborne oil has been sitting in the wrong port for two and a half months. The IEA called it the largest supply disruption in the history of the global oil market. Meanwhile, the S&P 500 closed at 7,412.84 on May 11 — its sixth straight winning week and another all-time high. Both the S&P and Nasdaq rallied more than 2% and 4% respectively the previous week. If your gut is telling you this makes no sense, congratulations, your gut works. The market just doesn't care what your gut thinks.
The Setup: A Genuinely Apocalyptic Backdrop
Let's not soft-pedal this. The fundamentals on the energy side are objectively grim. The EIA's May Short-Term Energy Outlook reports Brent averaged $117 per barrel in April, peaking at $138 on April 7, with global production shut-ins of roughly 10.5 million barrels per day. The UAE quit OPEC effective May 1, taking its spare capacity with it. The IEA says global oil inventories are drawing down at roughly 4 million barrels a day and the market will stay "severely undersupplied" through October even if the war ends next month.
Gas prices crossed $6 a gallon in Los Angeles, jet fuel is up 95% since the war started, Spirit Airlines shut down on May 2, and the Philippines declared a national energy emergency. Goldman Sachs ran a scenario where Brent averages above $100 for all of 2026 and as high as $120 in Q3 if Hormuz stays largely shut for another month. Maritime intel firm Windward described the Strait as "a supervised pause," not a reopening.
So, the obvious question: why is anyone buying stocks right now? Glad you asked. Pull up a chair.
Chart: stylized representation based on EIA, CNBC, and Bloomberg reporting. Brent prices from EIA May 2026 STEO; S&P 500 levels from CNBC daily market coverage.
Reason 1: Earnings Are Crushing It (No, Really)
The S&P 500 doesn't move on vibes. It moves on profits — and profits are flat-out booming. PNC's May 2026 outlook shows 84% of S&P 500 companies are beating Q1 expectations with an upside surprise of more than 1,200 basis points, revenue growth of +10% across every sector, and S&P 500 margins at a record 14.3%. U.S. Bank's strategy team puts full-year 2026 earnings growth above 20%. Their read: "resilient business and consumer spending."
You can dislike that read if you want, but it's what the tape is telling you. When 84% of companies beat estimates by double digits during what is supposed to be the worst energy crisis in history, the market is going to do its job and price that in. Stocks are claims on future cash flows. The cash flows have been, frankly, embarrassingly good.
Reason 2: The AI Capex Cycle Doesn't Care About Oil Tankers
Here's the part nobody likes to say out loud: the dominant story driving this index is not oil, not the Middle East, and not the Fed. It's hyperscaler capex on AI infrastructure. Charles Schwab notes that the post-war rally has been "extraordinarily concentrated around AI," with capex on data centers, semiconductors, and power infrastructure powering both U.S. and emerging market rebounds.
Apple beat on the bottom line and guided higher; the stock popped 3% on May 1. Nvidia and Corning announced a multi-billion-dollar partnership for new optical manufacturing in North Carolina and Texas. Samsung Electronics crossed $1 trillion in market cap. South Korea's Kospi is up more than 70% year-to-date thanks to AI-related chip demand. When the largest growth driver in your index is a multi-trillion-dollar infrastructure spending cycle largely insulated from crude prices, an oil shock just doesn't pack the same punch it did in 1973.
Reason 3: The U.S. Is Actually Winning This Oil Shock
This is the part that would have been unthinkable in the 1970s. The United States is not an oil-shock victim anymore — it's a net energy exporter. U.S. crude production was already at record levels above 13 million barrels per day entering 2026, and U.S. exports of crude and petroleum products hit nearly 12.9 million barrels a day on April 24. The S&P 500 energy sector is the best-performing group on the index this year.
Translation: every dollar Asia and Europe spend extra on imported crude is partially landing on the income statements of Exxon, Chevron, Marathon Petroleum, Valero, Halliburton, Baker Hughes, and SLB. Q2 energy earnings are now forecast to grow roughly 100% year-over-year. The same crisis that's pulverizing the Philippines is fattening U.S. corporate margins. The market sees that. The market reflects that.
Reason 4: Markets Are Pricing a Ceasefire That Keeps Almost-Happening
Every other week, somebody floats a deal. On May 6, an Axios report that the U.S. and Iran were close to an agreement sent the S&P up 1.46% and crude down 15% intraday. Iran sent a peace proposal through Pakistani mediators on May 1. Trump rejected it on May 10. Iran sent another counteroffer. Trump called it "TOTALLY UNACCEPTABLE!" on Truth Social. Rinse, repeat.
Each cycle of "almost a deal → not a deal" trains the market to buy the dip. Implied volatility in oil is the highest since early 2024, but equity vol is shockingly tame, because at this point traders genuinely believe a resolution is one Trump golf weekend away. They might be wrong. They have not, yet, been punished for being wrong.
Reason 5: Strong Hands Are Buying, Weak Hands Already Sold
One of the most underappreciated dynamics: the people who were going to panic already panicked in March. At one point earlier in the war, major indexes were down more than 10% from prior records. Everyone who didn't have the stomach for it got flushed. Whoever's still long — institutions, systematic strategies, passive flows — has a higher pain tolerance and a longer time horizon. BOK Financial's Dennis Kissler summed it up: "Oil prices haven't spiked as much as expected, and the U.S. economy remains resilient." When the worst-case scenario keeps not materializing, the path of least resistance is up.
The Mechanism: Why Oil Shocks Don't Always Kill Stocks
Let's get nerdy for a second. The textbook says oil up = stocks down via inflation → rate hikes → multiple compression. But the historical record is more complicated than the textbook. Stocks fell 40% in the 1973-1974 oil embargo. But in 1979, oil tripled and stocks went up — with one brief pullback. In 1990, Iraq invaded Kuwait, oil spiked, and the S&P fell 20%. In 1999-2000, Brent more than tripled and stocks crashed — but for dot-com reasons, not oil.
The pattern: a short, sharp oil shock isn't enough by itself to cause a bear market. It needs an accomplice — an overvalued market, weak earnings, a hawkish Fed, or a credit event. Right now, the accomplices are missing. The Fed cut rates in 2024 and 2025 and is signaling flexibility. Earnings are roaring. Credit spreads are tight. Corporate margins are at record highs.
| Historical Oil Shock | S&P 500 Reaction | Why It Did / Didn't Crash |
|---|---|---|
| 1973-74 Embargo | -40% | Stagflation, weak earnings, Bretton Woods collapse |
| 1979 Iranian Revolution | Up, mild dip in 1980 | Earnings held; oil was a slow burn, not a cliff |
| 1990 Gulf War (Kuwait) | -20% | Recession was already brewing |
| 2008 Oil Spike to $147 | -38% (full year) | Housing/credit crash, not oil itself |
| 2026 Hormuz Closure | +8% YTD, ATH | Record earnings, AI capex, U.S. is now a net exporter |
Sources: The Motley Fool / Yahoo Finance, IndexBox 2026 S&P 500 analysis.
So Should You Just Yolo Long Everything?
The risks are real and stacking up. A Dallas Fed paper estimates Q4-over-Q4 headline PCE inflation could rise between 0.2 and 1.8 percentage points in 2026 depending on closure duration. The longer Hormuz stays effectively shut, the more inventories deplete, and the closer the world gets to the genuinely scary scenarios where Goldman is modeling $200 Brent. Jeff Currie at Carlyle estimates a sustained closure could destroy 5-10 million barrels per day of demand — "similar to the seventies."
If your portfolio's bull case is "AI keeps printing money and the Middle East doesn't get worse," you should know that you have, mechanically, two coin flips going at once. The market can be right for months and then wrong in a week. U.S. Bank explicitly flags that if higher energy costs persist long enough to reprice growth expectations, investors will demand a larger risk premium — and the multiple compresses.
This is exactly the environment where managing downside actually matters. Trailing stops, position sizing, hedges — they're boring right up until they save you. If you're long an index that's gone up six weeks in a row while oil is parked above $108 and tankers are stuck in port, the question isn't whether you're smart enough to be long. The question is whether you have a plan for the week the narrative cracks.
Bottom Line
The S&P 500 climbing to record highs while the Strait of Hormuz is closed isn't a bug. It's the market doing exactly what it's supposed to do: weighing earnings against risks and pricing the result. Right now, that calculation is: 20%+ earnings growth + AI capex super-cycle + U.S. as net energy exporter > oil supply shock + geopolitical chaos + depleting inventories.
That math holds until it doesn't. The longer Hormuz stays shut, the heavier the right side of the scale gets. The market isn't wrong to be optimistic. It just isn't being paid a lot to be right.


