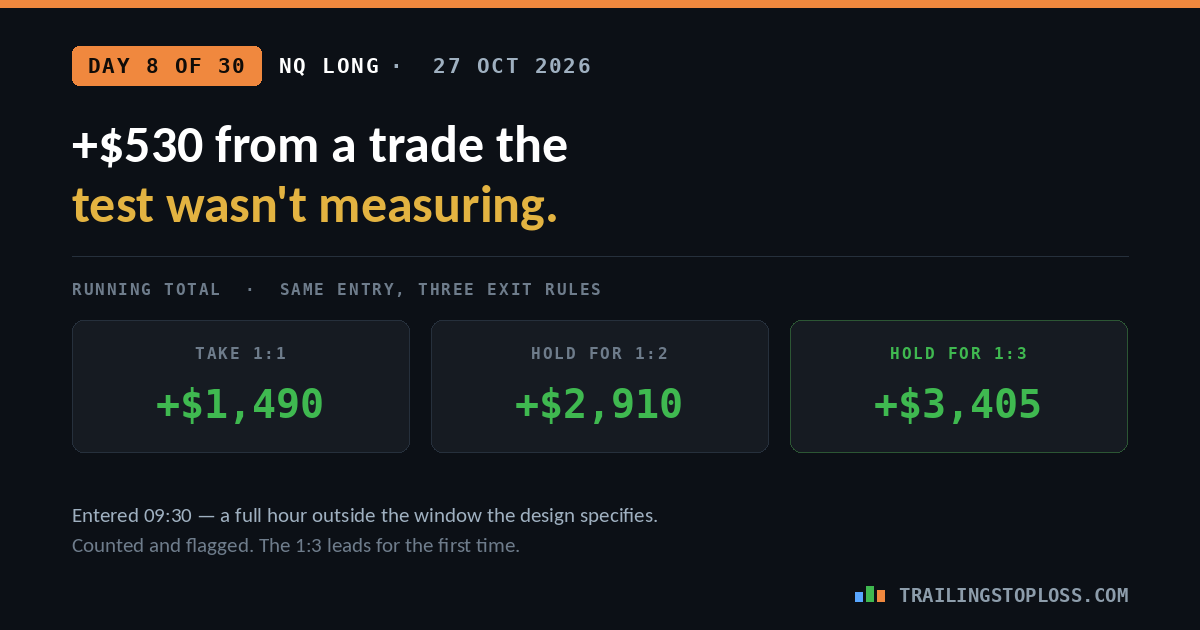
Day 8 of 30: A $530 Win From a Trade the Test Wasn’t Measuring
School run ran long, I reached the charts an hour after the open, and the setup I liked showed up at 09:30 — well outside the first-thirty-minutes window this test specifies. I took it anyway, with a market order rather than the usual stop, and it paid $530 while clearing all three target levels. It is the fourth straight day the 1:3 would have paid, and the first day it leads the table.
Which makes this the most awkward kind of entry to write up: a win that is not quite evidence for the thing being tested.
The trade


Three things made this different, and they all point the same way
It was an hour outside the window. The pre-registered design is one trade a day in the first thirty minutes after the 8:30 Central open. This entry filled at 09:30:25. That is not a marginal overrun; it is a different part of the session, with different participants and different volatility.
It was a market order. Every other entry in this series has been a stop order, which gives a visible trigger price and a visible fill and therefore a measurable slippage cost — a point against me on each of the last two. A market order removes that cost from view without necessarily removing it: you still pay the spread, you simply cannot see what you paid. Cheaper or not, it is no longer measured.
It took four times longer than the previous three trades combined. Days 5, 6 and 7 resolved in 23, 49 and 35 seconds. This one took 3 minutes 21 seconds. That is consistent with what you would expect an hour after the open: the opening drive is finished, the move is less urgent, and a continuation entry has to wait around for its resolution instead of being carried immediately.
Counting it, and flagging it. The same decision as day 4, when I broke the one-trade-a-day rule and reported the result in full rather than dropping the day. Deleting a trade because it was taken outside the protocol is indistinguishable, from the outside, from deleting a trade because it lost.
From here each entry also gets tagged in-window or out-of-window, so the day-30 summary can report the full set and the clean subset separately. That is the honest way to handle a protocol that real life keeps interrupting: record the breach, do not launder it.
The 4-hour read, and why it is not the test

The confluence on this trade was 4-hour structure, which was pushing firmly upward. That is the higher-timeframe context underneath every long in this series, and on a day when the opening window had already passed it was the thing that made a 09:30 entry look reasonable rather than impulsive.
It is also not what is being measured. The test compares three exit rules on a defined entry. A good 4-hour read is a reason to take a trade; it is not the entry definition, and a strategy of “a setup I liked, with supportive higher-timeframe structure, whenever I get to the screen” is a different strategy from the one on trial.
None of which makes the read wrong. Higher-timeframe context is the reason continuation entries have a direction to continue in at all, and the trade worked. The point is narrower: when the conditions of a test change, the result stops being a data point for that test even when the money is real.
All three levels, and the 1:3 takes the lead
Risk was 25.25 points from the fill, putting the levels at 29,649.50, 29,674.75 and 29,700.00. Calibrating the chart’s own level lines against the known entry and stop prices, the high sits roughly fifteen points above the 1:3.
| Target | Level | Reached? | Result |
|---|---|---|---|
| 1:1 | 29,649.50 | Yes — filled at 29,650.75 | +$530 |
| 1:2 | 29,674.75 | Yes | +$1,010 |
| 1:3 | 29,700.00 | Yes, by about 15 points | +$1,515 |
| Day | Take 1:1 | Hold 1:2 | Hold 1:3 | Note |
|---|---|---|---|---|
| 1 — 9 Oct | +$500 | −$500 | −$500 | In window |
| 2 — 12 Oct | −$565 | −$565 | −$565 | In window |
| 3 — 13 Oct | +$500 | +$1,000 | −$505 | In window |
| 4 — 14 Oct | −$1,025 | −$1,025 | −$1,025 | Two trades — breach |
| 5 — 20 Oct | +$510 | +$1,000 | +$1,500 | In window |
| 6 — 22 Oct | +$515 | +$990 | +$1,485 | In window |
| 7 — 26 Oct | +$525 | +$1,000 | +$1,500 | In window |
| 8 — 27 Oct | +$530 | +$1,010 | +$1,515 | 09:30 entry — breach |
| Running | +$1,490 | +$2,910 | +$3,405 | — |
| Hit rate | 6 of 9 | 5 of 9 | 4 of 9 | — |
The 1:3 leads for the first time, $495 clear of the 1:2 and $1,915 clear of the 1:1. Twelve days ago it was $2,595 underwater and the 1:1 was the obvious winner. Four consecutive trending sessions have done that, and one of them — this one — came from outside the protocol.
Two breaches in nine trades
Worth saying plainly, because it is the more useful finding than the money. Nine trades in, two have departed from the design: day 4 took a second trade nineteen minutes after the first stopped out, and day 8 was taken an hour outside the window because of a school run.
That is a 22% breach rate on a framework whose entire selling point is discipline, run by someone who writes about discipline for a living, on a demo account with nothing at stake. It is not a character failure. It is what a rigid time window does when it meets a morning that does not cooperate — and the honest conclusion is that a rule which only survives uneventful days is not yet a rule, it is a preference with good weather.
The fix is not more resolve. It is either a protocol that admits a defined fallback — say, a second window later in the session, specified in advance rather than improvised — or an explicit no-trade day when the first thirty minutes are missed. Both are honest. Improvising at 09:30 and counting the result as though nothing happened is not.
Still no MAE
Day 4 committed to logging maximum adverse excursion from day 5. Four trades later it still does not exist. Today’s entry was a market fill that moved into profit without threatening the stop at 29,599.00, so once again the honest entry would be “probably small,” and once again that is not a measurement.
Four omissions out of nine. At this rate the stop-width question — the one day 4 raised and the reason the column was promised — does not get answered at all.
The honest limits
- Nine trades, two of them protocol breaches. The clean subset is seven.
- The last four sessions are highly correlated. They are four draws from one trending stretch, not four independent tests of the strategy.
- A market order hides its own cost. There is no trigger price to measure the fill against, so today’s execution cost is unknown rather than zero.
- The 1:2 and 1:3 results are chart reads, not fills. The high was estimated by calibrating the chart’s level lines against the known entry and stop prices, which is a reasonable method and still an estimate.
- No MAE and no range width recorded, the latter being the variable the continuation analysis argued matters most. Both gaps are in the method, not the market.
- Demo account, one full-size NQ contract, roughly $505 of risk per trade.
The short version
- Market buy at 29,624.25, stop 29,599.00, target filled at 29,650.75. +26.50 points, +$530, held 3m 21s.
- Entered 09:30:25 CT — a full hour outside the first-thirty-minutes window the test specifies.
- Market order rather than the usual stop, which removes the visible slippage cost without necessarily removing the cost.
- Took four times longer to resolve than the previous three trades combined, which is what an hour after the open looks like.
- All three levels cleared; the 1:3 by roughly fifteen points.
- Running: 1:1 +$1,490, 1:2 +$2,910, 1:3 +$3,405. The 1:3 leads for the first time.
- Counted and flagged. Every future entry gets tagged in-window or out-of-window so the clean subset can be reported separately at day 30.
- Two breaches in nine trades on a discipline framework, on demo, with nothing at stake. That is the finding worth sitting with.
Frequently asked questions
Why count a trade that broke the protocol?
Because the alternative is a test whose sample is curated by the person being tested. Day 4 broke a different rule and was kept for the same reason. Dropping trades taken outside the design looks identical, from outside, to dropping trades that lost — and a published log is only worth anything if the reader can be confident nothing was quietly removed. The breach is recorded and the day-30 summary will report the clean subset separately.
Is a market order worse than a stop order here?
Not necessarily worse, but less measurable. A stop order shows a trigger price and a fill price, so the execution cost is visible — a point against on each of the last two entries. A market order has no reference price, so you pay the spread and cannot see what you paid. For a test that is partly about execution costs, invisible is the problem rather than expensive.
Does the 1:3 taking the lead settle anything?
No. Twelve days ago the same table had the 1:3 at −$2,595 and the 1:1 ahead, and that did not settle anything either. Four consecutive trending sessions are what moved it, and trending sessions reward width by construction. The running total reports market conditions at least as much as it reports strategy.
Should the window rule just be relaxed?
Possibly, but changed deliberately and in advance rather than abandoned on the mornings it is inconvenient. A specified second window, or an explicit no-trade rule when the first thirty minutes are missed, are both defensible designs. Improvising an entry at 09:30 and recording it as a normal day is the one option that is not, because it quietly converts the test into a measurement of something else.
Why did this trade take so much longer than the recent ones?
Most likely the time of day. The opening drive carries a continuation entry almost immediately, which is why days 5 to 7 resolved in under a minute each. An hour later the urgency has gone out of the move and the same entry has to wait for its resolution. One trade cannot establish that, but it is the obvious explanation and it is consistent with the window the design chose in the first place.
Related on this site: the 30-day test method · how continuation entries work · day 7 · day 6 · day 4, the other breach
All prices and timestamps are taken from the broker order log for CME_MINI:NQ1! on 27 October 2026; times are US Central. Dollar figures assume one full-size NQ contract at $20 per point. Risk is 25.25 points measured from the market fill at 29,624.25. Outcomes for the 1:2 and 1:3 targets are read from the price path rather than from filled orders; the session high was estimated by calibrating the chart’s own level lines against the known entry and stop prices. This entry was taken at 09:30:25, outside the first-thirty-minutes window the test specifies, and with a market order rather than the stop order used on every other entry; it is counted in the running totals and flagged, and the day-30 summary will report in-window trades separately. No maximum adverse excursion was recorded, the fourth consecutive omission. Demo account. Nine trades, four of them consecutive draws from one trending stretch, is a log rather than evidence. Nothing here is financial advice. Futures trading carries substantial risk of loss.


