The Adaptive Market Regime Detector is now live on TradingView — open-source Pine v6, free forever, no signup gate. It's a context filter that answers one question before every trade: what kind of market am I actually in? Background shading colors the chart by regime, a corner dashboard shows the live read with a confidence score, and a single alert fires on confirmed regime changes. Defaults are tuned for index futures (NQ, ES, MNQ, MES) on intraday charts and adapt to anything else automatically. Read the full breakdown on the Market Regime Detector landing page.
Install in 30 seconds. Open source. No signup. Pine v6.
Open on TradingView →Why another regime indicator
Search "regime" in TradingView's public script library and you'll find more options than you have time to test. Most of them fall into the same trap: a single hard-coded threshold doing the heavy lifting. "ADX above 25 means trending" is the canonical example, and it's the kind of rule that looks tidy in a tutorial and quietly falls apart in production. That number was calibrated on one instrument on one timeframe. Move it to a different symbol — or even the same symbol on a different session — and the boundary drifts without telling you. The reason is straightforward: volatility and trend distributions are wildly different across markets, and a fixed number can't track a moving target.
The fancier alternatives bolt machine learning onto the same idea — k-means clusters, KNN classifiers, even small neural nets running inside Pine. They're impressive on paper. In practice they tend to flicker between labels in exactly the transition zones where you most need a steady read, and they're black boxes you can't sanity-check during a live trade. The adaptive percentile approach this indicator uses sidesteps both problems: transparent math, no fixed thresholds, and a confirmation buffer that keeps the label stable through transitions.
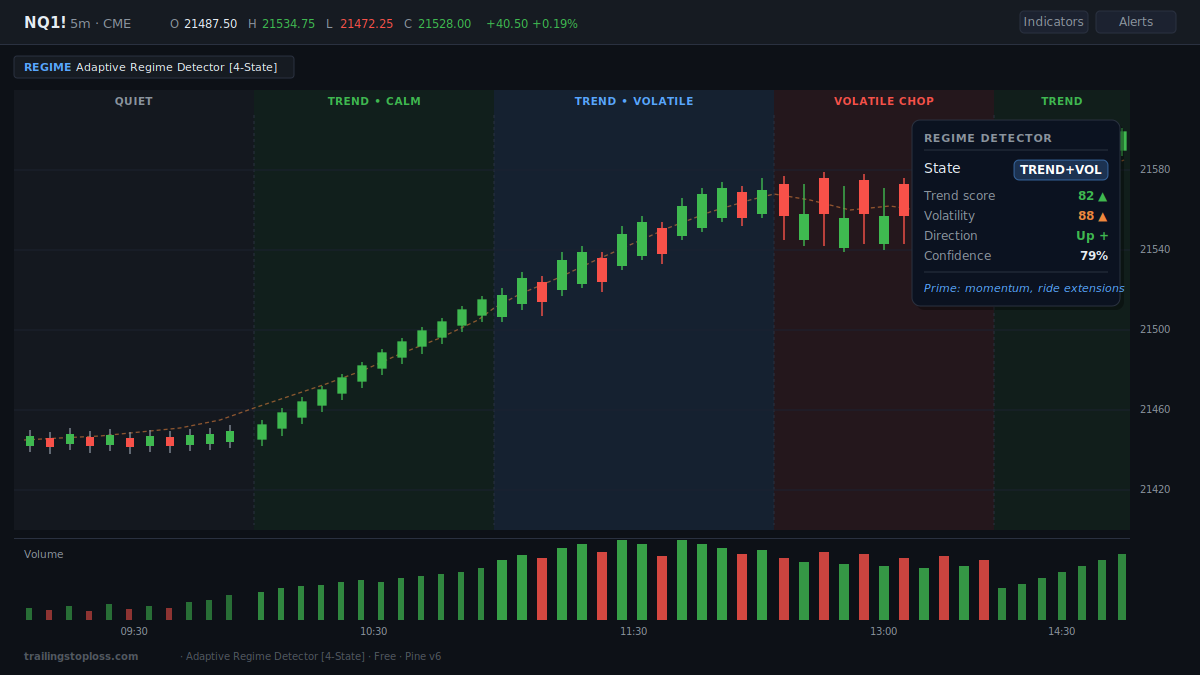
The four regimes shaded across a single session arc: quiet open, calm uptrend, volatile expansion, distribution chop, resumption.
The four regimes and why splitting them matters
Most regime tools recognize three states — trending, ranging, and "volatile." This one separates volatile into two opposite environments. The reason: a volatile trend and a volatile range are not the same trade. Lumping them together is the single biggest reason simple detectors mislead you, and splitting them is where the actual edge comes from.
TREND + VOLATILE
Direction and range together. The prime momentum environment for scalpers — the state most detectors fail to distinguish from chop.
TREND + CALM
Orderly directional grind with muted volatility. The textbook pullback environment — clean structure, predictable retracements.
VOLATILE CHOP
Wide candles going nowhere. High volatility, no net direction. The account-killer — stand down or switch to mean reversion.
QUIET RANGE
Low volatility, no direction. A dead session. Reduce size or wait — most setups don't pay in this state.
What makes the adaptive approach different
Self-calibrating, not hard-coded. Every metric — the Kaufman Efficiency Ratio for trend cleanliness, the ATR-normalized EMA slope for directionality, ATR and Bollinger width for volatility — gets ranked against its own recent distribution using percentile scoring. A reading qualifies as "volatile" because it sits in the top third for this symbol on this timeframe, not because it crossed a number tuned on someone else's chart. Load it on NQ 1-minute, BTC 4-hour, or EUR/USD daily and the engine recalibrates without you touching a setting.
Two axes, four states. A trend score crossed against a volatility score produces four genuinely distinct regimes instead of the usual three. The trend axis combines Kaufman's efficiency measure with slope; the volatility axis combines two complementary range measures. Full math is on the landing page.
Anti-flicker confirmation buffer. A regime only changes after three consecutive bars agree. That trades a small amount of lag for label stability — the read holds steady through transition zones instead of strobing the way k-means and threshold classifiers tend to. All logic runs on confirmed bars, so it doesn't repaint.
How to install
30 seconds, no signup, no email gate, no upgrade screen.
- Open the script on TradingView and click the star icon to add to favorites.
- Open any chart and click Indicators in the top toolbar.
- Click Favorites and select Adaptive Regime Detector.
- Click the gear icon next to the indicator name to adjust the percentile lookback for your timeframe.
Quick timeframe guidance: on the 1-minute, lower the percentile lookback to ~80–100. On the 5-minute, the default of 120 is well-placed. On the 15-minute and above, raise it toward 150–200 so the baseline draws from roughly two full sessions of context. Everything else is timeframe-neutral by design.
Works on every prop firm platform
Because it runs natively on TradingView, the indicator follows you to any prop firm or broker platform that integrates TradingView charts — which is most of them in 2026. Whether you're funded on Apex, evaluating at Topstep, or running an account through Tradovate or TopstepX, the same regime read loads on every chart you open. Browse the vetted prop firm directories for futures, forex, and crypto firms compatible with TradingView execution.
What it won't do
It will not tell you where to enter or exit, and any indicator that claims to is selling you something. This is a context filter. It tells you whether the current environment favors momentum, pullback entries, mean reversion, or sitting on your hands. Pair it with your own entry trigger and risk plan, and pair it well — the regime read tells you which tool to reach for in your kit, not where to swing it. If you want a sense of what a finished trading workflow looks like, the TradingView indicators directory lays out how the regime detector slots in next to the volume tools.
It will also lag genuine regime shifts by a few bars, because the confirmation buffer is deliberately conservative — that's the price of label stability. And on a freshly loaded chart with very little history, the percentile scores can be jumpy until enough bars accumulate for the distributions to stabilize. Both are documented behaviors, not bugs.
Frequently asked questions
How is this different from an ADX or Choppiness Index filter?
Those rely on fixed thresholds — a single number calibrated on one market that silently misfires on others. This detector ranks every metric against its own recent distribution, so the boundary between trending and ranging recalibrates to whatever symbol and timeframe you load it on. It also splits volatile trend from volatile chop, which single-metric filters can't do.
Does it repaint?
No. All classification logic runs on confirmed bars and the anti-flicker confirmation buffer only advances the regime once enough completed bars agree. The label on a historical bar is the one assigned when that bar closed.
What timeframe should I use it on?
Defaults are tuned for intraday index futures (NQ, ES, MNQ, MES). It works on any timeframe because the engine is adaptive, but the percentile lookback is worth adjusting: lower it for the 1-minute, leave it for the 5-minute, raise it for the 15-minute and higher.
Can I get an alert when the regime changes?
Yes. A single alert fires on confirmed regime changes with the new regime name and confidence reading in the message. Because it only triggers after the confirmation buffer clears, you won't get spammed by every flicker in a transition zone.
Is it really free?
Free, full stop. No paid tier, no upgrade prompts, no premium unlocks. The full Pine v6 source is visible on the TradingView script page so you can audit how every regime is computed before you trust it on a live chart.


