Every trading influencer on the internet has drawn a horizontal line on a chart, watched price bounce off it once, and declared themselves a market wizard. Here’s the inconvenient truth: support and resistance levels, on their own, are not a trade signal. They’re context. The traders who consistently get paid treat horizontal levels and supply and demand zones as confluence — one piece of evidence in a stack — not as a magic line that mints money every time price touches it. Investopedia
This article breaks down what supply and demand zones actually are, how they form on the chart, and — more importantly — how to use them as confluence inside a real trading plan instead of blindly clicking buy because price tagged a rectangle you drew last Tuesday. All chart examples below use the 1-hour timeframe, which is a sweet spot for zone trading: enough structure to matter, without the noise of the 1-minute chart convincing you that every three-candle pullback is “institutional accumulation.” TrendSpider
What Supply and Demand Zones Actually Are
A supply or demand zone is an area on the chart where a large imbalance between buyers and sellers caused price to leave in a hurry. The logic is simple: when institutions need to fill size, they can’t do it in one click without moving the market against themselves. So they accumulate in a tight range (the “base”), and when price finally explodes away, unfilled orders are often left behind. When price returns to that area later, those leftover orders — and the traders who watch for them — tend to produce a reaction. XBTFX
A demand zone forms where price fell, paused briefly, then rallied hard — buyers overwhelmed sellers at that price. A supply zone is the mirror image: price rallied, stalled, then got dumped — sellers were waiting and they weren’t shy about it. The key ingredient in both cases is the strength of the departure. A zone that price drifted away from lazily is decoration. A zone price left like the building was on fire is worth marking. XS
Demand Zone: Drop → Base → Rally
A 1H demand zone: price drops into a base, departs aggressively, then bounces on the first retest. The base candles define the zone, not the wicks of the rally.
The classic demand formation is drop–base–rally (a reversal pattern) or rally–base–rally (a continuation pattern). In both cases you mark the zone around the base candles: the distal line at the lowest point of the base, the proximal line at the top of the base bodies. The tighter the base and the more violent the departure, the more interesting the zone. FXOpen
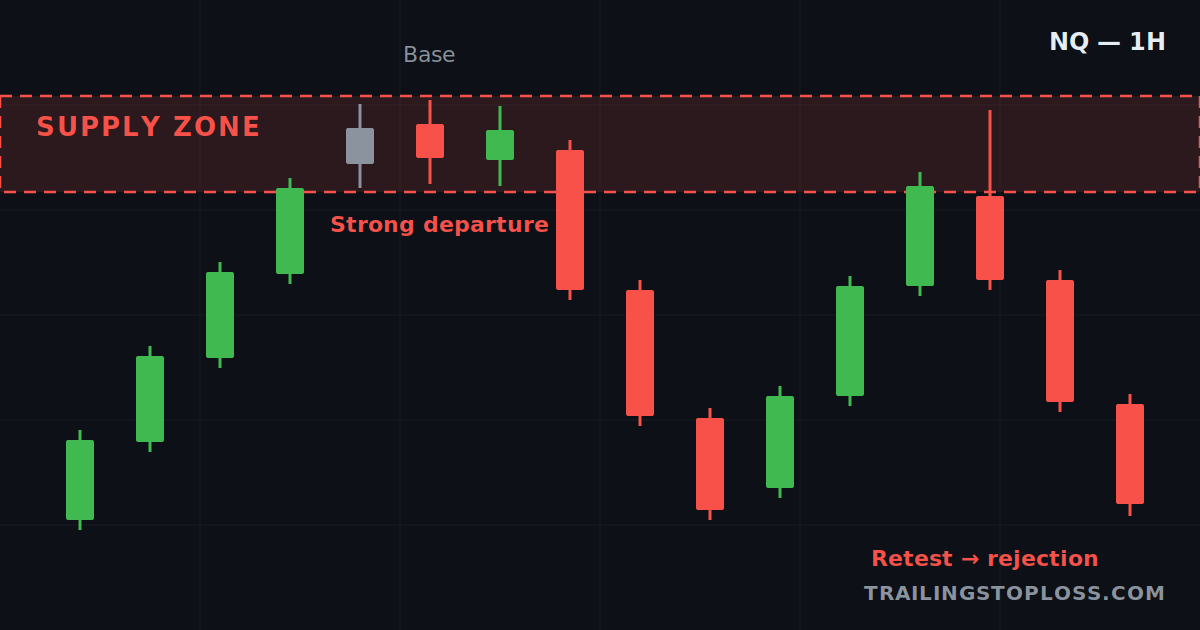
Supply Zone: Rally → Base → Drop
A 1H supply zone: rally, distribution base, aggressive sell-off — then a retest that gets wicked back into the floor. Sellers were still home.
Supply zones are where the rally–base–drop sequence played out, and on indices like NQ they tend to be sloppier than demand zones because short-side participation is thinner in a long-biased market. That’s not a reason to ignore them — it’s a reason to demand more confluence before fading strength into one. A 1H supply zone sitting alone in the middle of nowhere is a suggestion; a 1H supply zone stacked under prior resistance with momentum fading is a setup. ATAS
Zones vs. Classic Support and Resistance
Classic support and resistance marks where price reacted before. Supply and demand zones attempt to explain why — pointing at the order-flow imbalance that caused the move instead of just the memory of it. In practice the two overlap constantly, and that overlap is exactly the point: when a fresh 1H demand zone forms right on top of a level that’s already acted as support multiple times, you’re no longer looking at one piece of evidence. You’re looking at two independent reasons for buyers to show up at the same price. XBTFX
| Concept | What it marks | Strength as a standalone signal |
|---|---|---|
| Support / Resistance | Price levels with historical reactions | Weak — everyone sees them, including the algos that hunt them |
| Supply / Demand zone | Areas of order-flow imbalance with strong departures | Moderate — better location, still no context on its own |
| Zone + level + trend + trigger | Confluence stack | This is the actual trade |
How to Use Zones as Confluence (the Whole Point)
Confluence trading means you don’t act on the zone — you act on the agreement between the zone and everything else on your chart. A demand zone is your location. The confluence is what tells you whether the location deserves your money: prior support or resistance at the same price, the higher-timeframe trend, VWAP or a session level, volume behavior on the approach, and a price-action trigger when price actually arrives. The more independent factors agreeing at one price, the more you can size with conviction — and the easier it is to define exactly where you’re wrong. LuxAlgo
The confluence stack on the 1H: a fresh demand zone sitting on prior support, a pullback in an uptrend, an engulfing trigger, stop below the distal line, target at the opposing supply zone.
The Confluence Checklist
- Higher-timeframe alignment. A 1H demand zone inside a 4H/daily uptrend is a pullback entry. The same zone in a daily downtrend is you trying to catch a falling piano with confidence.
- Level overlap. The zone gains weight when it sits on prior support/resistance, a session high/low, the overnight low, or yesterday’s value area — levels other participants are also watching.
- VWAP / moving average confluence. Price pulling into a demand zone that also intersects VWAP or a respected MA stacks mechanical buyers on top of your zone.
- Zone freshness. First retest is the highest-probability touch. Every revisit consumes resting orders; by the third or fourth tap, the zone is mostly vibes.
- Volume behavior. Declining volume on the pullback into the zone, expanding volume on the reaction out of it. The opposite pattern is the market telling you the zone is about to get steamrolled.
- A trigger. An engulfing candle, a failed breakdown, a lower-timeframe shift in structure — something that confirms buyers actually showed up, instead of you donating a limit order to the order flow gods.
Notice what’s not on that list: “price touched the zone.” Touching the zone is the invitation, not the trade. The traders who blow up prop evaluations are usually the ones treating every zone tag as an entry, then revenge-trading the retest of the retest. If you’re going to trade these setups on a funded account, your zone strategy and your risk parameters need to be decided before the session opens, not improvised at 9:31. Flux Charts
Entries, Stops, and Targets Around Zones
There are two ways to enter at a zone, and they’re a straight trade-off between price and certainty. The limit entry (set-and-forget order at the proximal line) gets you the best price and the widest reward-to-risk, but eats full losses when the zone fails without a fight. The confirmation entry waits for the trigger candle or a lower-timeframe structure shift inside the zone — worse price, fewer losers. For 1H zones on NQ, confirmation entries are usually worth the few points of slippage, because index futures love to spike through a zone’s distal line by a hair before reversing, specifically to ruin your day. TrendSpider
Stops go beyond the distal line of the zone — below a demand zone, above a supply zone — with a buffer for the obligatory wick. If your stop is inside the zone, you don’t have a stop, you have a donation schedule. Targets are the opposing zone or the next meaningful level; if the next 1H supply zone is so close that the trade can’t return at least 2R, the setup doesn’t qualify no matter how pretty the confluence is. Run your numbers through a position size and stop-loss calculator before entry, because “I’ll figure out size when I’m in” is how trailing drawdowns get introduced to account balances. LuxAlgo
Common Mistakes That Turn Zones Into Tuition
- Drawing zones everywhere. If your 1H chart has eleven rectangles on it, you don’t have a strategy, you have abstract art. Two or three quality zones per direction, maximum.
- Ignoring the departure. A base that price wandered away from is not a zone. You want displacement — big-bodied candles leaving in one direction.
- Trading stale zones. The first retest matters most. The fifth retest is support-and-resistance cosplay.
- Fading strong trends from lone supply zones. Counter-trend at a zone without higher-timeframe confluence is the fastest way to learn what “trend continuation” means experientially.
- Skipping the trigger. Limit orders into zones during high-impact news releases are a charitable contribution to whoever’s on the other side.
- No risk plan. Zone trading without predefined size, stop, and daily loss limit is just gambling with better-looking charts. Our daily pre-market briefing maps the key levels before the open so the plan exists before the adrenaline does.